Research on localization of noise sources in boundary layer transition at the bow of underwater vehicle
-
摘要:
为研究水下航行体首部边界层转捩区的噪声特性及声源位置,本文采用缩比SUBOFF模型在高速水洞中开展了试验研究。水洞试验段来流速度为3~7 m/s,基于模型长度的雷诺数为107量级,首部表面布置14支脉动压力传感器,测量了首部层流边界层、转捩和湍流边界层的脉动压力场。为定位声源位置,采用传声器阵列进行了水下航行体首部主要噪声源的三维声源定位,定位方法为基于小波变换的函数波束形成方法。试验结果表明:随着来流速度增大,首部边界层转捩起始位置不断向前移动,同时脉动压力频谱中的中频分量显著增加。声源定位结果表明:水下航行体首部主要噪声源呈三维环形分布,且声源所在流向位置与边界层转捩区位置基本重合,表明边界层转捩区是水下航行体首部的主要噪声源。
Abstract:The boundary layer transition at the bow of an underwater vehicle (UV) is one of the major sources of the fairing self-noise. To study the noise characteristics of the boundary layer transition at the bow of UV and the sound source locations, a scaled SUBOFF model was adopted for the experimental study in a high-speed water tunnel. The inflow velocity of the water tunnel test section was 3 – 7 m/s, and the Reynolds number based on the model length was about 107. In addition, fourteen dynamic pressure sensors were arranged on the bow surface to measure the fluctuating pressure field within the region of laminar, transition and turbulent boundary layers. A phased microphone array was employed to locate the three-dimensional sound source at the bow of SUBOFF. The localization method adopts a functional beamforming method based on time-frequency transformation. The experimental results demonstrate that the transition position of the bow boundary layer moves forward synchronously with the increase of the incoming flow speed. Meanwhile, the amplitude of the mid-frequency component of the fluctuating pressure spectrum significantly rise. Furthermore, the results of sound source location show that the three-dimensional sound source presents a ring shape, and the streamwise position of the sound source almost coincides with the transition position of the boundary layer. This indicates that the transition region of the boundary layer is the main noise source in the bow region of the underwater vehicle.
-
0 引 言
水下航行体的主要噪声包括水动力噪声、机械噪声和螺旋桨噪声。随着机械噪声和螺旋桨噪声得到有效抑制,水动力噪声的影响愈显突出,亟待开展有效抑制水下航行体水动力噪声相关研究[1-2]。
水下航行体在高速航行时,物面边界层经过层流、转捩和充分发展湍流等3个流动状态。层流边界层为稳定的流动,湍流边界层为时间和空间上随机变化的流动。水动力噪声既包括边界层转捩区不均匀流动引发的单极子噪声,又包括充分发展湍流区湍流边界层内随机脉动压力直接产生的辐射噪声,还包括脉动压力激励物面弹性结构振动产生的辐射噪声[1]。水下航行体马赫数较小,可以忽略湍流脉动压力的直接声辐射(四极子噪声源)。
众多研究表明,层流向湍流转捩过渡区的脉动压力比充分发展湍流区的脉动压力均方级(脉动压力均方级数学定义为20lg(prms/pref),prms为脉动压力均方根,水下参考声压pref = 1 × 10⁻⁶ Pa)高10余分贝[1, 3-5]。20世纪60年代,Haddle等[6]进行浮体流噪声试验时,就注意到首部转捩区的平面换能器测得的表面脉动压力明显高于其他部位。Arakeri[7]的试验也表明,自然过渡回转体头部转捩区的脉动压力均方级为下游湍流区的3.0~3.5倍。刘建华等[5]的试验结果表明:转捩区壁面脉动压力总谱级比湍流区高9~17 dB,比层流区高20 dB以上。
脉动压力既包含流体脉动压力,又包含噪声脉动压力,前者不向外辐射传播,而后者可以向外辐射传播,因此,强脉动压力并不代表强噪声源[8-9]。表面边界层转捩区是否为水下航行体首部的主要噪声源,目前尚未得到试验证实或证伪。
基于传声器阵列的声源定位方法是目前应用最为广泛的声源位置确定方法[10-13],已经成功应用于翼型自噪声[14]、飞机机体噪声[15-16]、螺旋桨噪声[17]等方面的研究,研究者还发展了多种声源定位算法。但是,目前国内外学者尚未采用传声器阵列针对水下航行体首部的主要噪声源开展研究。
本文采用传声器阵列进行水下航行体首部噪声源三维定位,确定主要噪声源的空间位置,并结合水下航行体首部表面布置的脉动压力传感器,确定边界层转捩区位置,以证实表面边界层转捩区为水下航行体首部的主要噪声源。
1 试 验
1.1 模 型
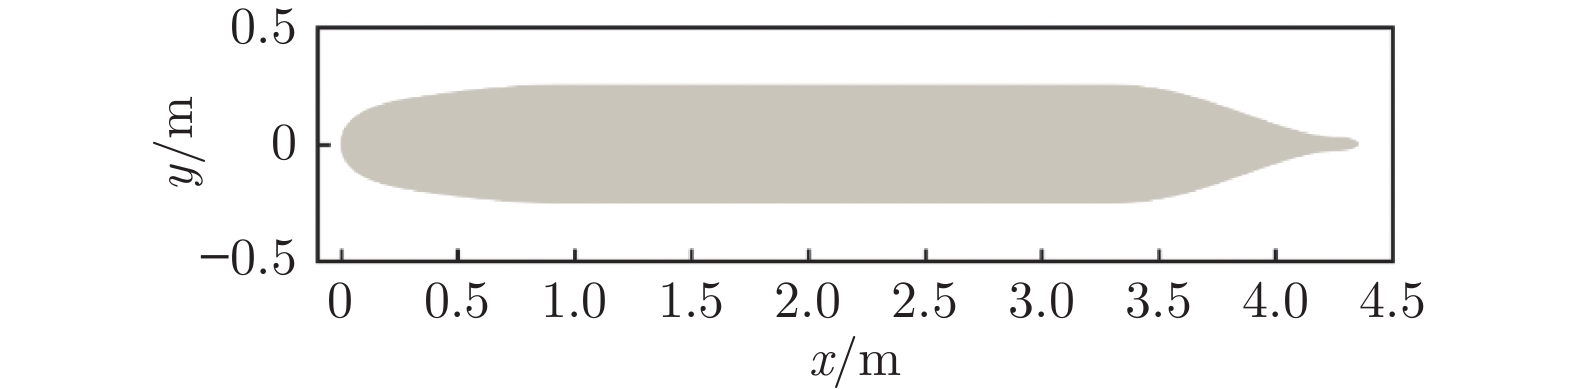
采用1∶1全尺寸SUBOFF模型(图1)在大型低噪声循环水槽中开展试验。模型长度为4.356 m、最大直径为508 mm,基于模型长度的雷诺数为107量级。大型低噪声循环水槽试验段宽2.2 m、高2.0 m、长10.5 m,水速为1.0~15.0 m/s,背景湍流度低于0.5%。水槽下方为水声测量舱,长9.5 m、宽2.2 m、高2.6 m,四壁采用吸声尖劈进行消声处理。
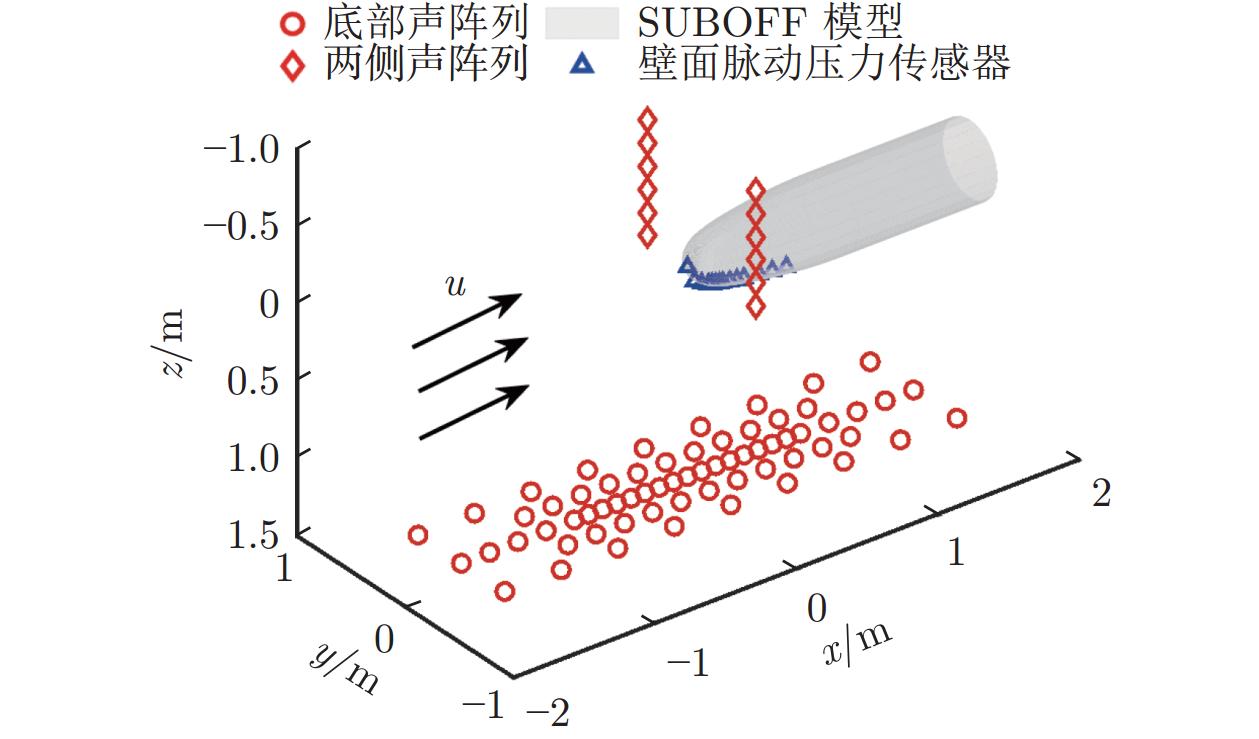
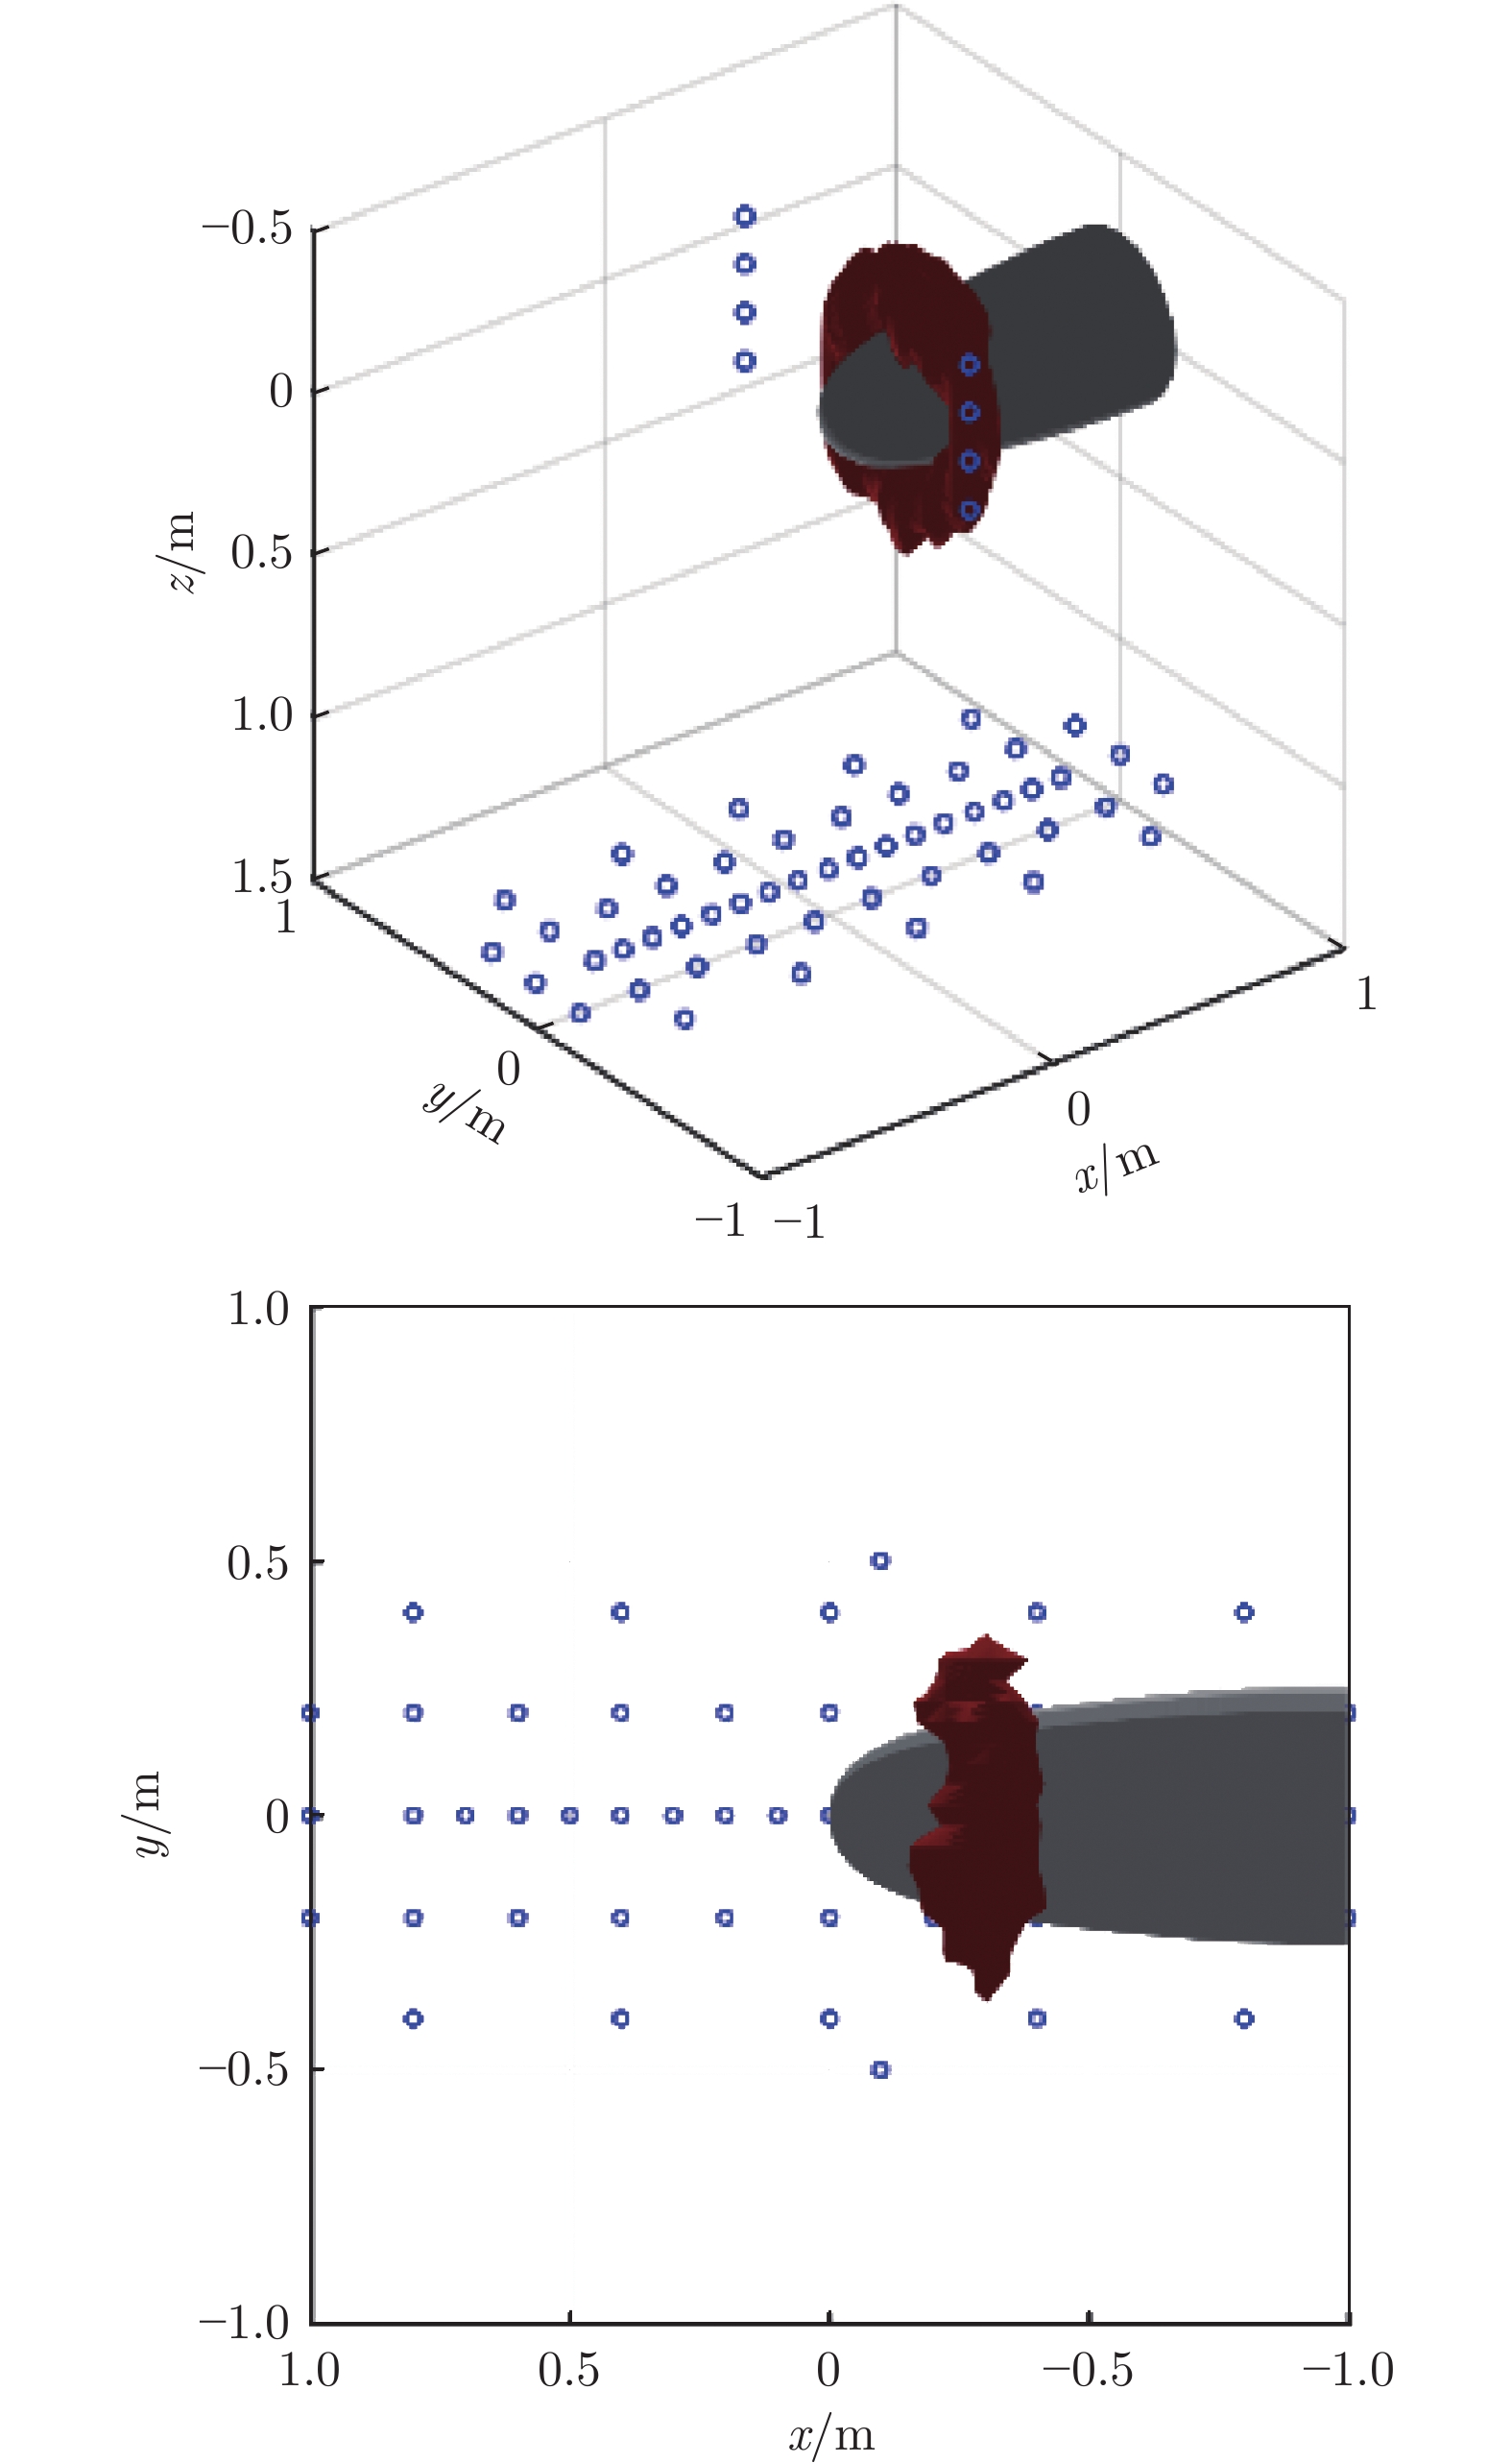
采用三维传声器阵列确定水下航行器首部主要噪声源的空间位置。如图2所示,该传声器阵列包括水槽底部65支传声器(图中红色圆形)组成的平面阵列和两侧壁各6支传声器(图中红色菱形)组成的线阵列。模型首部沿流向布置了14支脉动压力传感器(图中蓝色三角形),测量模型表面脉动压力信号,以确定首部表面边界层的流动状态。表1为压力传感器流向位置坐标(坐标系如图1所示,x轴正方向为流向)。
表 1 脉动压力传感器流向位置Table 1 The streamwise position of the pressure sensors传感器 流向位置x/mm 传感器 流向位置x/mm MIC 1 0 MIC 8 250 MIC 2 50 MIC 9 300 MIC 3 100 MIC 10 350 MIC 4 150 MIC 11 400 MIC 5 175 MIC 12 508 MIC 6 200 MIC 13 600 MIC 7 225 MIC 14 700 1.2 工 况
在0~6.8 m/s之间12个来流速度u(0、1.0、1.5、2.0、3.2、3.5、4.0、4.5、5.0、5.5、6.5、6.8 m/s)下开展试验,以研究水下航行体首部边界层流动和噪声源随来流速度的变化规律。
2 结果分析
2.1 壁面脉动压力分析
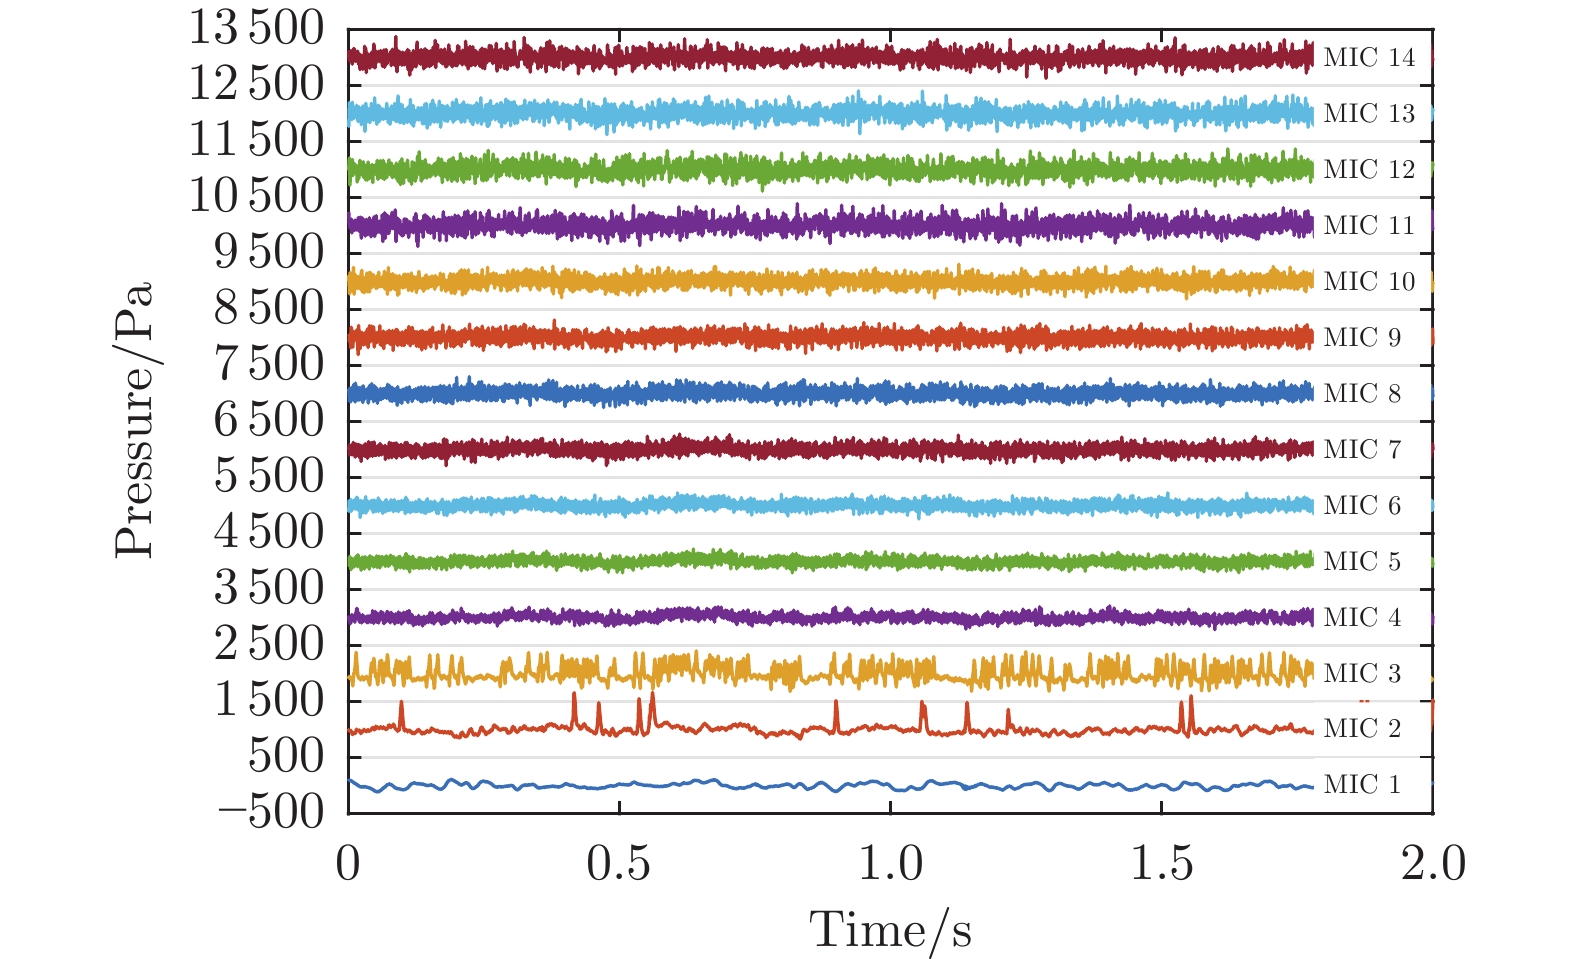
图3为来流速度6.5 m/s时各脉动压力传感器测得的脉动压力时域信号。为了更清晰地观察对比时域信号的波动程度,从第2个传感器开始,脉动压力结果相比前一个传感器都人为增加1 kPa,以使每条时域曲线都处于相同大小的幅值区间。从图中可以看出:MIC 1处,脉动压力波动较为平滑,幅值也较小;MIC 2处,脉动压力信号中随机出现了一些幅值很大的陡峭尖峰,这些尖峰是由边界层转捩引起的;当来流流过MIC 3时,压力尖峰更多;来流继续向下游流动,传感器测得的脉动压力信号已完全随机,边界层充分发展为湍流边界层。
![]() 图 3 来流速度6.5 m/s时的脉动压力时域信号Fig. 3 Time domain pressure signals of different wall pressure sensors at a flow velocity of 6.5 m/s
图 3 来流速度6.5 m/s时的脉动压力时域信号Fig. 3 Time domain pressure signals of different wall pressure sensors at a flow velocity of 6.5 m/s图4为12个来流速度下各脉动压力传感器测得的脉动压力均方根。从图中可以看到:随着来流速度增大,脉动压力均方根增大;在同一来流速度下,脉动压力均方根分布并非均匀增大,而是在边界层转捩区达到最大值。
![]() 图 4 不同来流速度下的脉动压力均方根对比Fig. 4 Comparison of root mean square of fluctuating pressure under different inflow velocities
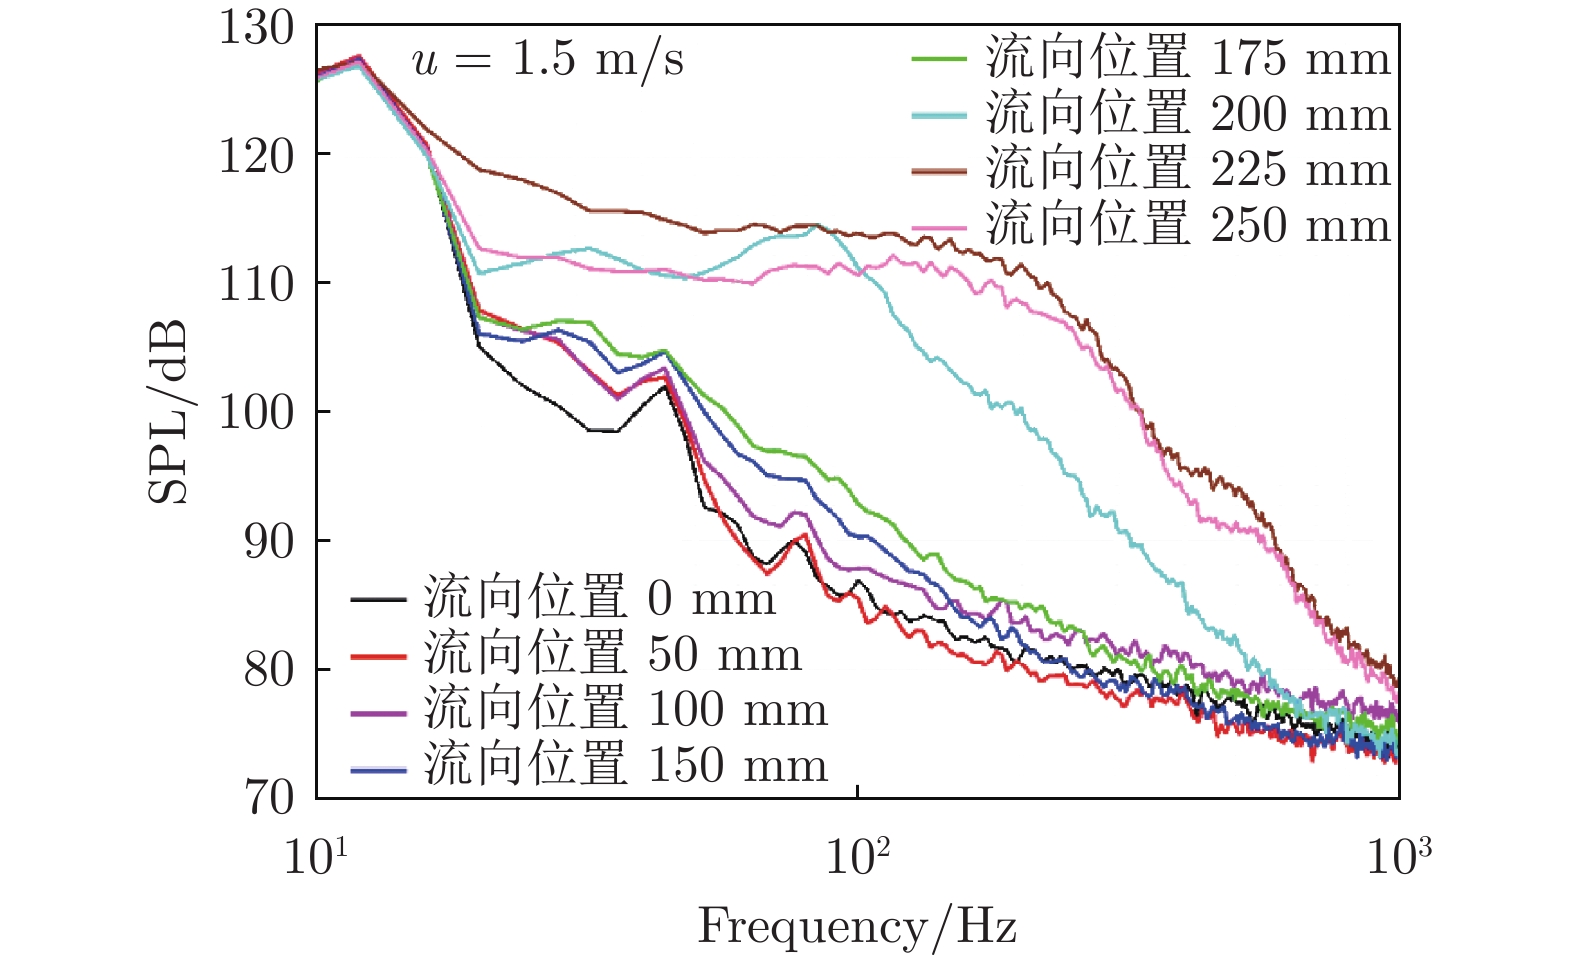
图 4 不同来流速度下的脉动压力均方根对比Fig. 4 Comparison of root mean square of fluctuating pressure under different inflow velocities图5为来流速度1.5 m/s时水下航行体首部边界层脉动压力频谱沿流向的变化趋势,图6为对应的脉动压力频谱曲线对比。可以看出:在水下航行体端部(流向位置0 mm处),脉动压力在整个频率范围内都较小,这是因为该处边界层处于层流状态;随着测点向下游移动,脉动压力频谱呈略增大趋势。当测点流向位置为200 mm时,脉动压力频谱幅值在中频范围(20~500 Hz)显著增大,这说明边界层从层流状态转变为转捩状态,这种状态并不稳定,很快就转变为充分发展的湍流状态。
![]() 图 5 来流速度1.5 m/s时首部边界层脉动压力频谱沿流向变化趋势Fig. 5 Tendency of fluctuating pressure spectra on the underwater vehicle at the flow velocity of 1.5 m/s
图 5 来流速度1.5 m/s时首部边界层脉动压力频谱沿流向变化趋势Fig. 5 Tendency of fluctuating pressure spectra on the underwater vehicle at the flow velocity of 1.5 m/s![]() 图 6 来流速度1.5 m/s时首部边界层脉动压力频谱对比Fig. 6 Comparison of fluctuating pressure spectra on the underwater vehicle at the flow velocity of 1.5 m/s
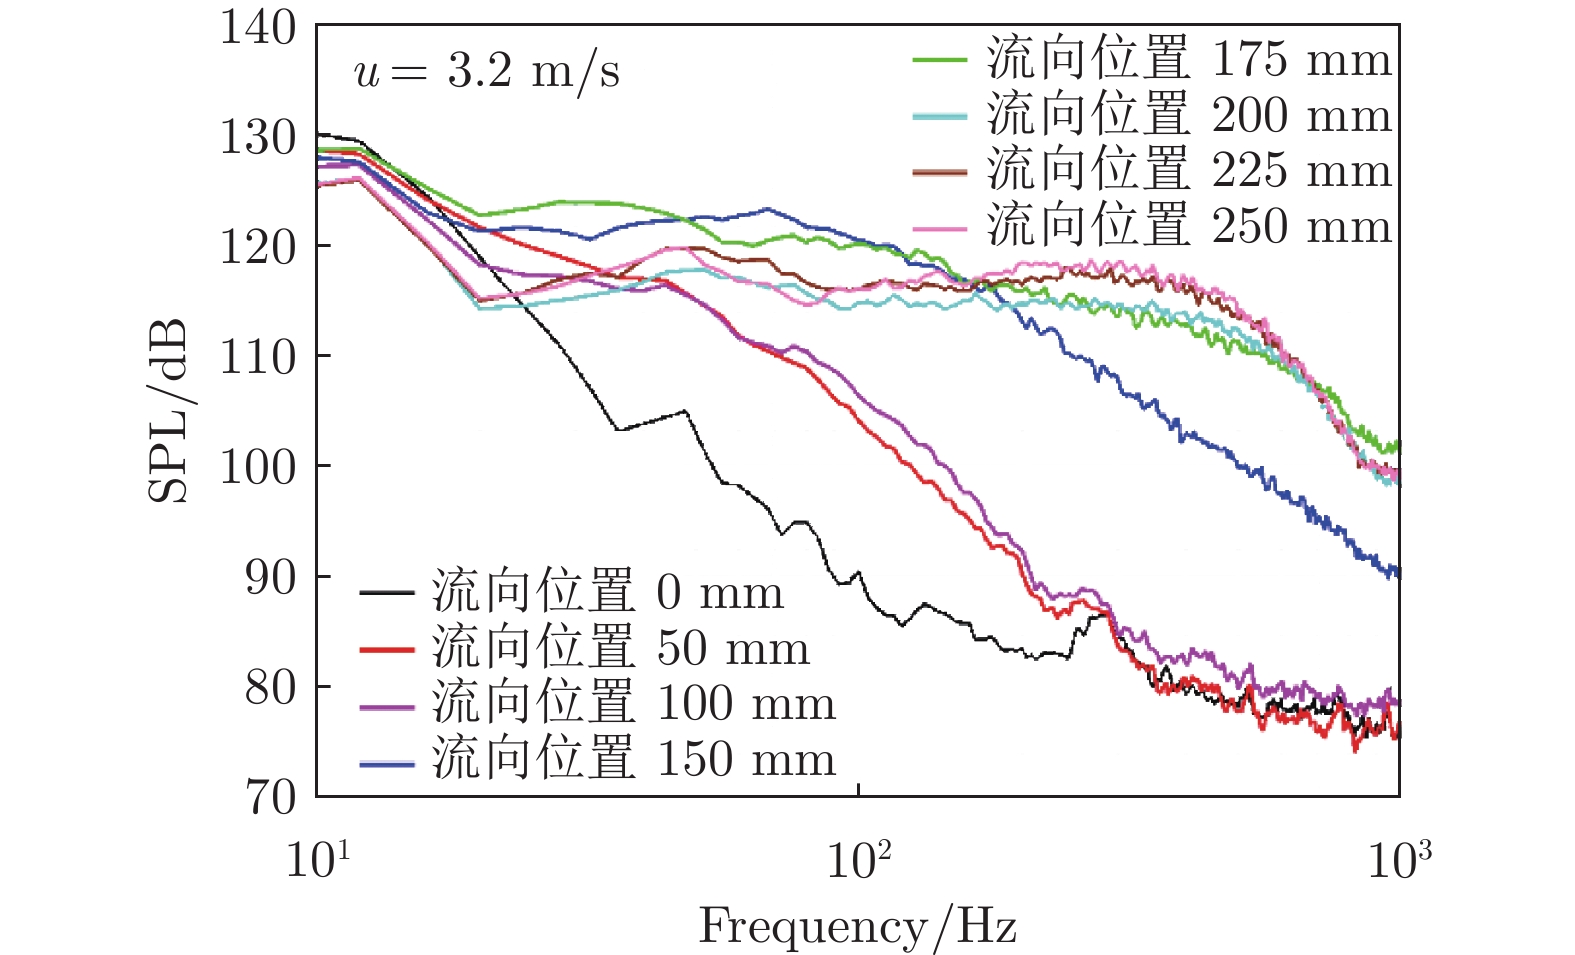
图 6 来流速度1.5 m/s时首部边界层脉动压力频谱对比Fig. 6 Comparison of fluctuating pressure spectra on the underwater vehicle at the flow velocity of 1.5 m/s图7为来流速度3.2 m/s时首部边界层脉动压力频谱沿流向变化趋势,图8为对应的脉动压力频谱曲线对比。可以看出:流向位置0 mm处,脉动压力仍在整个频率范围内都较小,这是因为该处边界层仍处于层流状态;测点流向位置为50 mm时,脉动压力频谱在中频范围(20~1000 Hz)显著增大,说明边界层发生了从层流状态到转捩状态的转变。
![]() 图 7 来流速度3.2 m/s时首部边界层脉动压力频谱沿流向变化趋势Fig. 7 Comparison of fluctuating pressure spectra on the underwater vehicle at the flow velocity of 3.2 m/s
图 7 来流速度3.2 m/s时首部边界层脉动压力频谱沿流向变化趋势Fig. 7 Comparison of fluctuating pressure spectra on the underwater vehicle at the flow velocity of 3.2 m/s![]() 图 8 来流速度3.2 m/s时首部边界层脉动压力频谱对比Fig. 8 Tendency of fluctuating pressure spectra on the underwater vehicle at the flow velocity of 3.2 m/s
图 8 来流速度3.2 m/s时首部边界层脉动压力频谱对比Fig. 8 Tendency of fluctuating pressure spectra on the underwater vehicle at the flow velocity of 3.2 m/s图9对比了首部边界层转捩起始位置随来流速度变化的趋势:随着来流速度增大,首部表面边界层转捩起始位置不断前移。这主要是因为来流速度增大,引起雷诺数增大,进而导致流动不稳定性增大。图10对比了首部边界层脉动压力频谱随来流速度变化的趋势:随着来流速度增大,首部转捩区的脉动压力频率范围不断扩大。这主要是因为来流速度增大导致边界层转捩区包含的湍流涡结构更加丰富,小尺度湍流涡不断增多。
![]() 图 9 不同流速下首部边界层转捩起始位置对比Fig. 9 Comparison of fluctuating pressure spectra on the underwater vehicle at different flow velocities
图 9 不同流速下首部边界层转捩起始位置对比Fig. 9 Comparison of fluctuating pressure spectra on the underwater vehicle at different flow velocities![]() 图 10 不同流速下首部边界层脉动压力频谱对比Fig. 10 Comparison of fluctuating pressure spectra on the under-water vehicle at different flow velocities
图 10 不同流速下首部边界层脉动压力频谱对比Fig. 10 Comparison of fluctuating pressure spectra on the under-water vehicle at different flow velocities为研究水下航行体首部表面脉动压力间歇性特性,对局部间歇度量(Local Intermittency Measure, LIM)[18-19]进行了计算,计算公式为:
$$ {\mathrm{LIM}}(s, t) = w(s, t)^{2}/\left\langle {w(s, t)^{2} } \right\rangle$$ (1) 式中:$\left\langle { \cdot } \right\rangle$表示时间平均,w(s, t)为脉动压力信号的小波变换,s为时间尺度,t为当前时刻。LIM大于1,代表流动能量大于平均能量的事件。
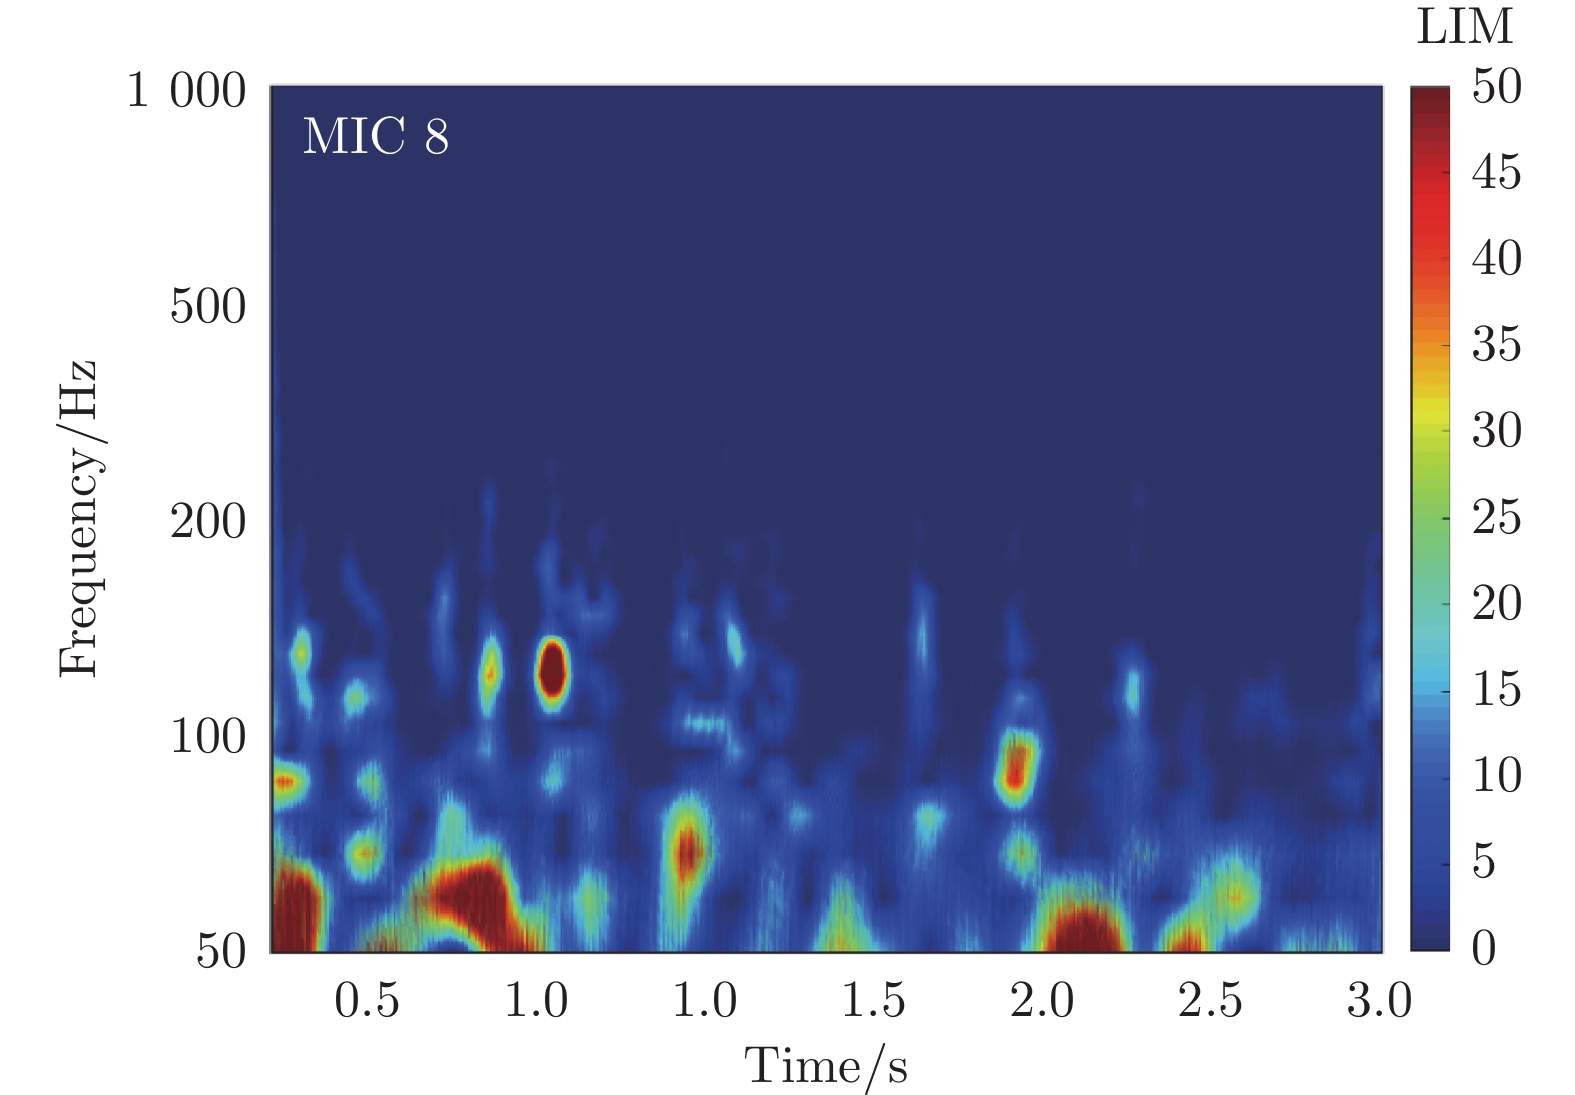
从来流速度1.0 m/s时MIC 8处的LIM云图(图11)可以看出能量非均匀分布,非常大的LIM区域意味着转捩区域,边界层能量分布具有间歇性。
![]() 图 11 来流速度1.0 m/s时MIC 8处的局部间歇度量Fig. 11 LIM computed from a segment of a pressure signal taken at 1.0 m/s and MIC 8
图 11 来流速度1.0 m/s时MIC 8处的局部间歇度量Fig. 11 LIM computed from a segment of a pressure signal taken at 1.0 m/s and MIC 82.2 声源定位方法及结果分析
2.1节的分析显示:水下航行体首部边界层转捩区具有间歇性特性,而传统频域声源定位方法计算互谱矩阵时采用了分段时间平均[10],无法准确分辨声源位置和时刻。因此,本文采用基于小波变换的三维声源定位方法[20-21]。此外,水下航行体具有三维回转外形,表面噪声源也具有三维分布特性,而平面传感器阵列在法向的分辨率很低,无法得到准确的水下航行体三维声源分布。为提高传统波束形成方法的空间分辨率,本文采用基于小波变换的函数波束形成方法[21]进行水下航行体首部声源定位。
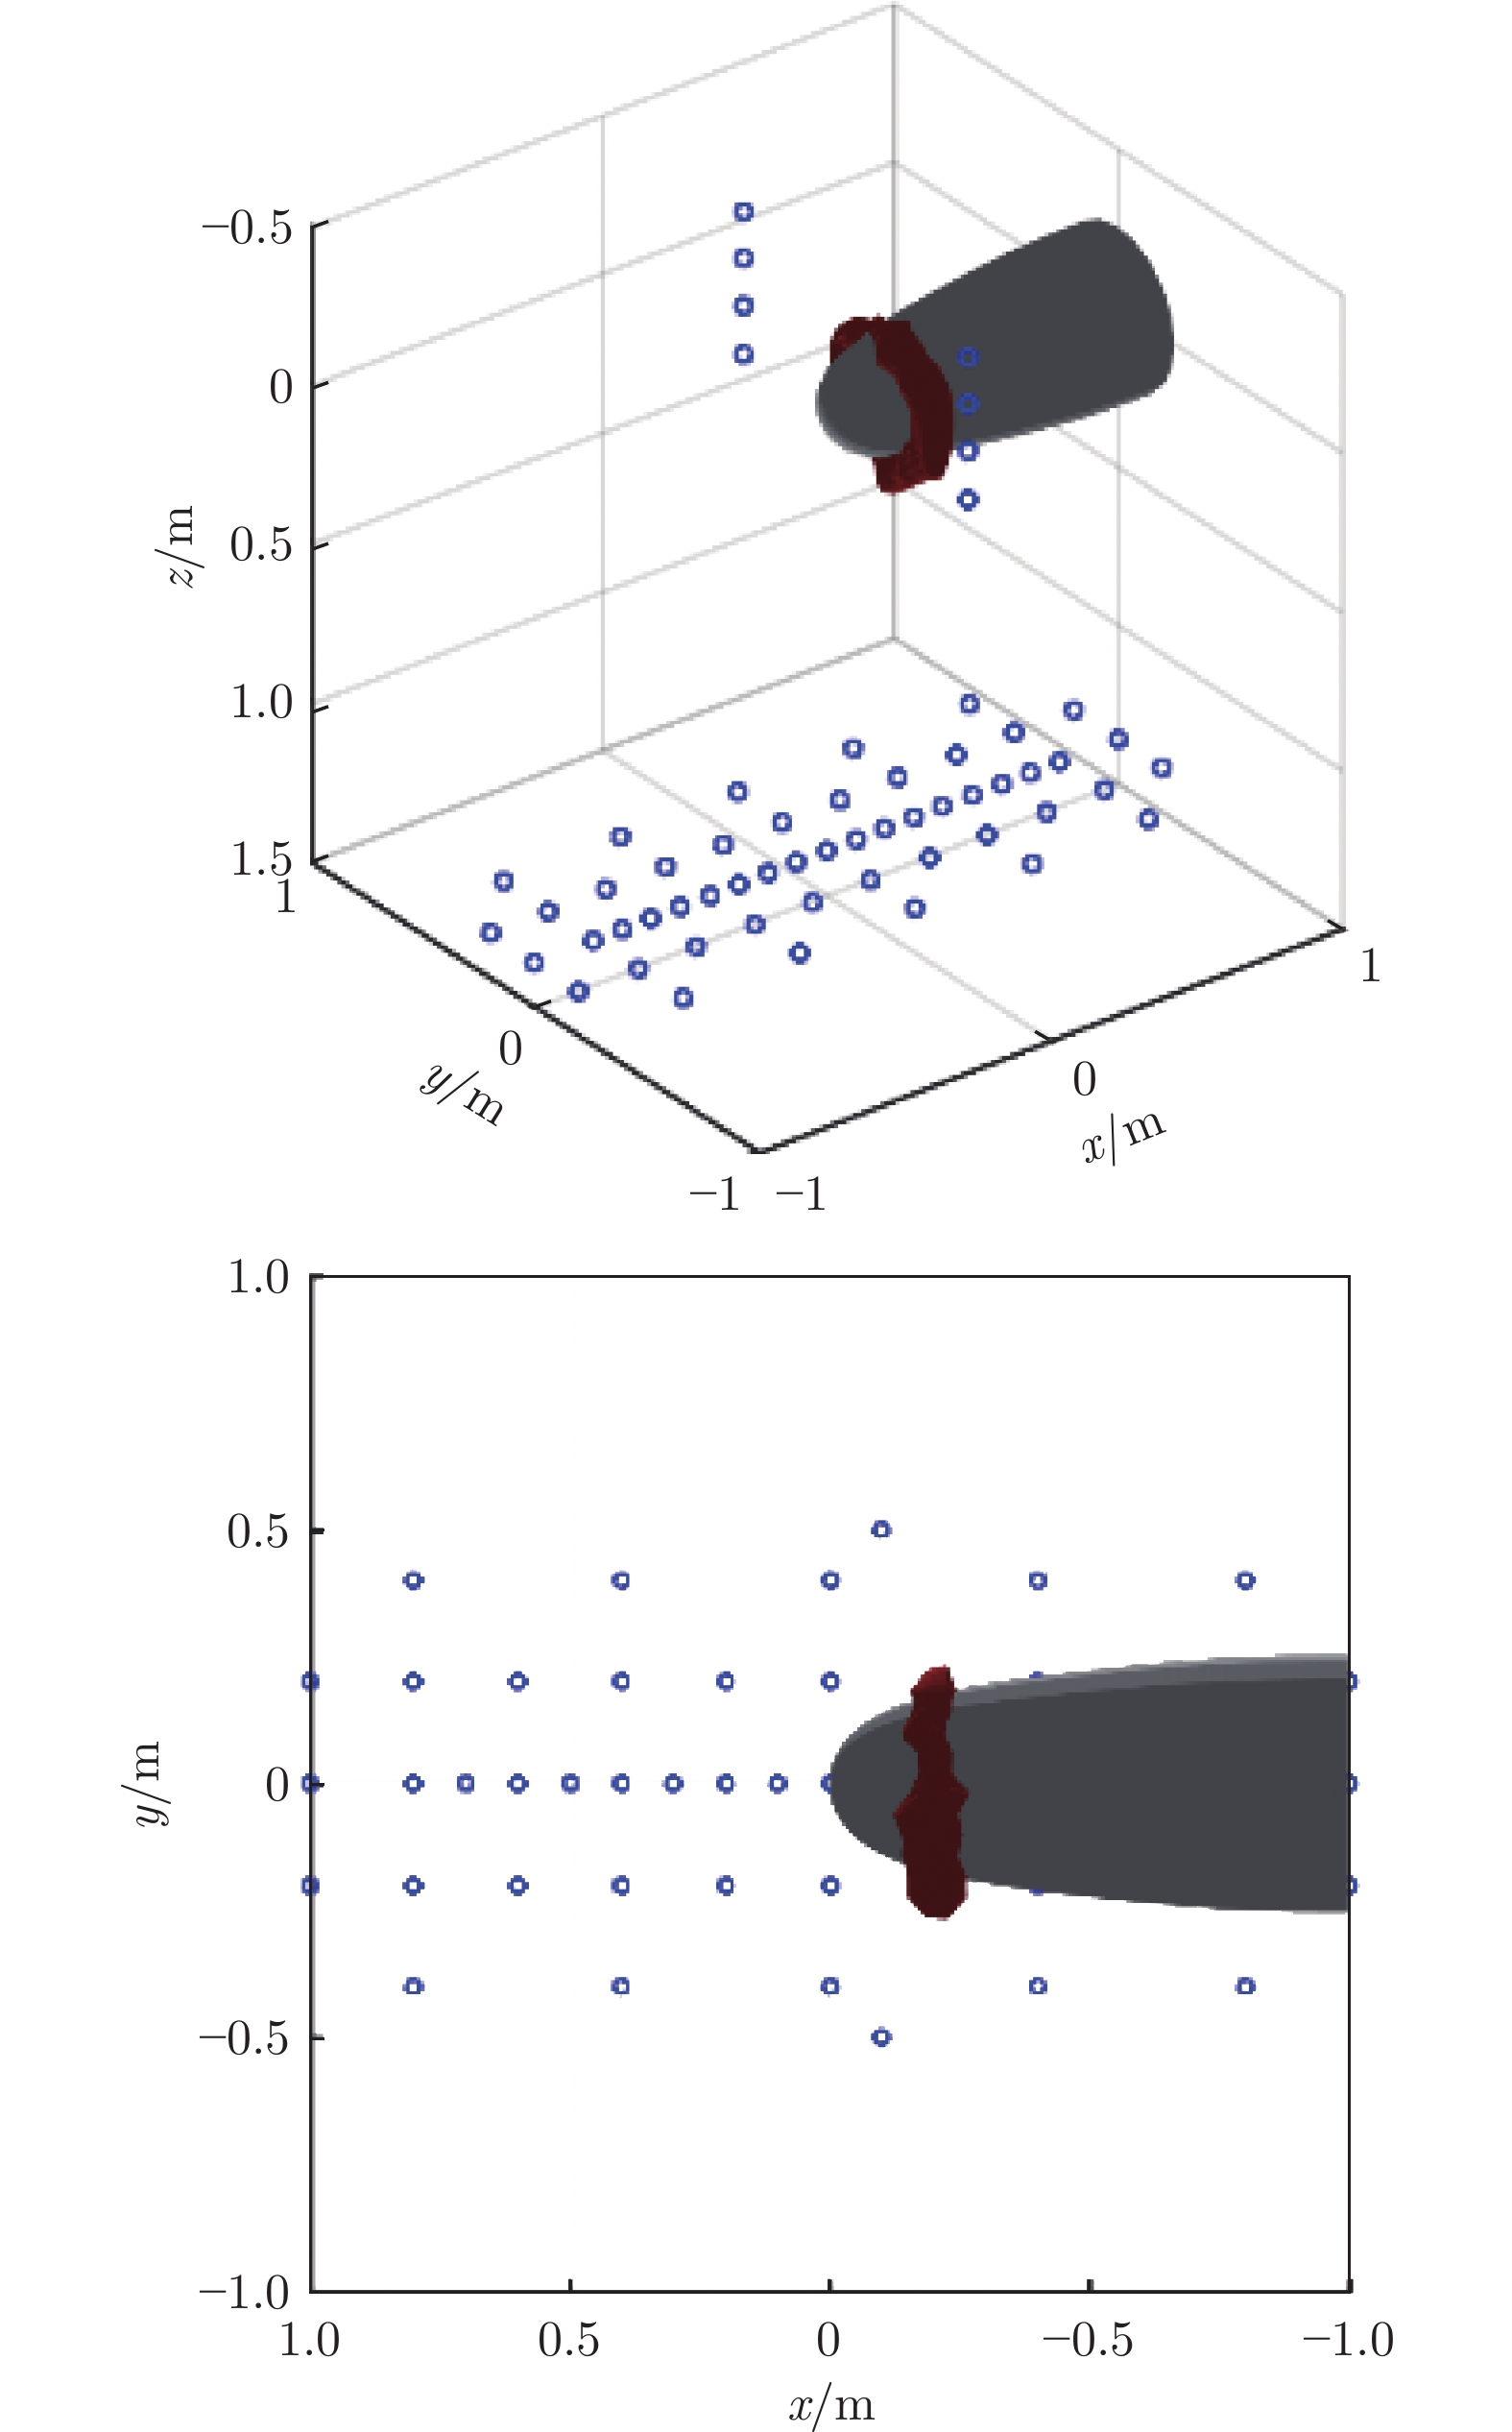
图12为来流速度1.0 m/s、声源频率100 Hz时水下航行体首部三维瞬时声源定位结果:首部主要声源呈环形分布,声源流向位置约为200 mm,与表面脉动压力传感器测得的转捩起始位置接近,这说明水下航行体首部转捩区是主要噪声源。
![]() 图 12 来流速度1.0 m/s、声源频率100 Hz时的声源分布Fig. 12 The source distribution at 100 Hz with flow velocity of 1.0 m/s
图 12 来流速度1.0 m/s、声源频率100 Hz时的声源分布Fig. 12 The source distribution at 100 Hz with flow velocity of 1.0 m/s图13为来流速度4.0 m/s时首部的三维瞬态声源定位结果。此时声源频率为400 Hz,对应的无量纲频率斯特劳哈尔数与来流速度1.0 m/s、声源频率100 Hz时的斯特劳哈尔数相等。从图中可以看出:声源呈三维环形分布,流向位置与首部边界层转捩区流向位置非常接近;与来流速度1.0 m/s时相比,来流速度4.0 m/s时的声源流向位置更靠近上游。
![]() 图 13 来流速度4.0 m/s、声源频率400 Hz时的声源分布Fig. 13 The source distribution at 400 Hz with the flow velocity of 4.0 m/s
图 13 来流速度4.0 m/s、声源频率400 Hz时的声源分布Fig. 13 The source distribution at 400 Hz with the flow velocity of 4.0 m/s图14为来流速度6.5 m/s时水下航行体首部三维瞬态声源定位结果。此时声源频率为650 Hz,与来流速度1.0 m/s和4.0 m/s时保持相等的斯特劳哈尔数。图中具有类似的声源分布,且声源流向位置更加前移,也与首部边界层转捩区流向位置非常接近,表明边界层转捩区正是首部的主要噪声源。
![]() 图 14 来流速度6.5 m/s、声源频率650 Hz时的声源分布Fig. 14 The source distribution at 650 Hz with the flow velocity of 6.5 m/s
图 14 来流速度6.5 m/s、声源频率650 Hz时的声源分布Fig. 14 The source distribution at 650 Hz with the flow velocity of 6.5 m/s3 结 论
对水下航行体首部表面边界层流动的脉动压力和主要噪声源位置进行了试验研究,得到如下结论:
1)水下航行体首部表面边界层转捩区起始位置随来流马赫数增大而前移;随着来流速度增大,转捩区的脉动压力频谱向中高频移动。
2)水下航行体首部声源流向位置与转捩区流向位置非常接近,且随着来流速度增大,相同斯特劳哈尔数下的声源位置也不断向上游移动,说明边界层转捩区是水下航行体首部的主要噪声源。
-
![]()
图 10 不同流速下首部边界层脉动压力频谱对比
Fig. 10 Comparison of fluctuating pressure spectra on the under-water vehicle at different flow velocities
![]()
图 3 来流速度6.5 m/s时的脉动压力时域信号
Fig. 3 Time domain pressure signals of different wall pressure sensors at a flow velocity of 6.5 m/s
![]()
图 4 不同来流速度下的脉动压力均方根对比
Fig. 4 Comparison of root mean square of fluctuating pressure under different inflow velocities
![]()
图 5 来流速度1.5 m/s时首部边界层脉动压力频谱沿流向变化趋势
Fig. 5 Tendency of fluctuating pressure spectra on the underwater vehicle at the flow velocity of 1.5 m/s
![]()
图 6 来流速度1.5 m/s时首部边界层脉动压力频谱对比
Fig. 6 Comparison of fluctuating pressure spectra on the underwater vehicle at the flow velocity of 1.5 m/s
![]()
图 7 来流速度3.2 m/s时首部边界层脉动压力频谱沿流向变化趋势
Fig. 7 Comparison of fluctuating pressure spectra on the underwater vehicle at the flow velocity of 3.2 m/s
![]()
图 8 来流速度3.2 m/s时首部边界层脉动压力频谱对比
Fig. 8 Tendency of fluctuating pressure spectra on the underwater vehicle at the flow velocity of 3.2 m/s
![]()
图 9 不同流速下首部边界层转捩起始位置对比
Fig. 9 Comparison of fluctuating pressure spectra on the underwater vehicle at different flow velocities
![]()
图 11 来流速度1.0 m/s时MIC 8处的局部间歇度量
Fig. 11 LIM computed from a segment of a pressure signal taken at 1.0 m/s and MIC 8
![]()
图 12 来流速度1.0 m/s、声源频率100 Hz时的声源分布
Fig. 12 The source distribution at 100 Hz with flow velocity of 1.0 m/s
![]()
图 13 来流速度4.0 m/s、声源频率400 Hz时的声源分布
Fig. 13 The source distribution at 400 Hz with the flow velocity of 4.0 m/s
![]()
图 14 来流速度6.5 m/s、声源频率650 Hz时的声源分布
Fig. 14 The source distribution at 650 Hz with the flow velocity of 6.5 m/s
表 1 脉动压力传感器流向位置
Table 1 The streamwise position of the pressure sensors
传感器 流向位置x/mm 传感器 流向位置x/mm MIC 1 0 MIC 8 250 MIC 2 50 MIC 9 300 MIC 3 100 MIC 10 350 MIC 4 150 MIC 11 400 MIC 5 175 MIC 12 508 MIC 6 200 MIC 13 600 MIC 7 225 MIC 14 700  下载: 导出CSV
-
[1] 刘进, 吕世金, 高岩. 水下航行体艏部转捩区激励特性试验研究[C]//第三十一届全国水动力学研讨会论文集. 2020. LIU J, LYU S J, GAO Y. Experimental study on excitation characteristics of transition zone near the bow of underwater vehicle[C]//Proceedings of the 31st National Conference on hydrodynamics. 2020.
[2] 俞孟萨, 吴有生, 庞业珍. 国外舰船水动力噪声研究进展概述[J]. 船舶力学, 2007, 11(1): 152–158. DOI: 10.3969/j.issn.1007-7294.2007.01.019 YU M S, WU Y S, PANG Y Z. A review of progress for hydrodynamic noise of ships[J]. Journal of Ship Mechanics, 2007, 11(1): 152–158. doi: 10.3969/j.issn.1007-7294.2007.01.019
[3] LIU Y Y, PAN C, LIU J H. Intermittent behavior of a bypass transition of boundary layers over an axisymmetric body of revolution[J]. Ocean Engineering, 2023, 286: 115689. doi: 10.1016/j.oceaneng.2023.115689
[4] MENG X X, CAO L S, SHEN Z B, et al. Numerical investigation on transitional boundary layer of submarine with different bow shapes[C]//Proc of the 10th Conference on Computational Methods in Marine Engineering. 2023. doi: 10.23967/marine.2023.084
[5] 刘建华, 徐良浩, 翟树成, 等. 水凝胶对曲面边界层转捩影响研究[C]// 第十二届全国流体力学学术会议论文摘要集. 2022. [6] HADDLE G P, SKUDRZYK E J. The physics of flow noise[J]. The Journal of the Acoustical Society of America, 1969, 46(1B): 130–157. doi: 10.1121/1.1911663
[7] ARAKERI V H. A note on the transition observations on an axisymmetric body and some related fluctuating wall pressure measurements[J]. Journal of Fluids Engineering, 1975, 97(1): 82–86. doi: 10.1115/1.3447222
[8] LI S, RIVAL D E, WU X H. Sound source and pseudo-sound in the near field of a circular cylinder in subsonic conditions[J]. Journal of Fluid Mechanics, 2021, 919: A43. doi: 10.1017/jfm.2021.404
[9] MANCINELLI M, PAGLIAROLI T, DI MARCO A, et al. Wavelet decomposition of hydrodynamic and acoustic pressures in the near field of the jet[J]. Journal of Fluid Mechanics, 2017, 813: 716–749. doi: 10.1017/jfm.2016.869
[10] MERINO-MARTÍNEZ R, SIJTSMA P, SNELLEN M, et al. A review of acoustic imaging methods using phased micro-phone arrays[J]. CEAS Aeronautical Journal, 2019, 10(1): 197–230. doi: 10.1007/s13272-019-00383-4
[11] CHEN W Q, ZHONG S Y, HUANG X. Extended-resolution acoustic imaging of low-frequency wave sources by acoustic analogy-based tomography[J]. Journal of Fluid Mechanics, 2020, 899: A12. doi: 10.1017/jfm.2020.461
[12] PAILHAS Y, PETILLOT Y. Large MIMO sonar systems: a tool for underwater surveillance[C]//Proc of the 2014 Sensor Signal Processing for Defence (SSPD). 2014: 1-5. doi: 10.1109/SSPD.2014.6943332.
[13] BRACA P, GOLDHAHN R, FERRI G, et al. Distributed information fusion in multistatic sensor networks for under-water surveillance[J]. IEEE Sensors Journal, 2016, 16(11): 4003–4014. doi: 10.1109/JSEN.2015.2431818
[14] JIANG M, LI X D, TONG W M. Identification and localization of airfoil noise sources at low angles of attack[C]//Proc of the 52nd Aerospace Sciences Meeting. 2014. doi: 10.2514/6.2014-0018
[15] BAI B H, LIN D K, LI X D. Identification of flap side-edge two-source mechanism based on phased arrays[J]. AIAA Journal, 2022, 60(1): 249–260. doi: 10.2514/1.j060377
[16] BAI B H, ZHANG Y Z, LI X D, Identification of the two-sources at the aircraft slat/fuselage juncture based on phased array[J]. Aerospace Science and Technology, 2023, 135: 108186. doi: 10.1016/j.ast.2023.108186
[17] MURRAY H H IV, DEVENPORT W J, ALEXANDER W N, et al. Aeroacoustics of a rotor ingesting a planar boundary layer at high thrust[J]. Journal of Fluid Mechanics, 2018, 850: 212–245. doi: 10.1017/jfm.2018.438
[18] FARGE M. Wavelet transforms and their applications to turbulence[J]. Annual Review of Fluid Mechanics, 1992, 24: 395–458. doi: 10.1146/annurev.fl.24.010192.002143
[19] CAMUSSI R, GUJ G. Orthonormal wavelet decomposition of turbulent flows: intermittency and coherent structures[J]. Journal of Fluid Mechanics, 1997, 348: 177–199. doi: 10.1017/s0022112097006551
[20] CHEN W Q, HUANG X. Wavelet-based beamforming for high-speed rotating acoustic source[J]. IEEE Access, 2018, 6: 10231–10239. doi: 10.1109/ACCESS.2018.2795538
[21] HE J Y, BAI B H, ZHANG Y Z, et al. Wavelet-based functional beamforming method for aeroacoustics moving sources localization[C]//Proc of the 2021 4th International Conference on Information Communication and Signal Processing (ICICSP). 2021: 244-248. doi: 10.1109/ICICSP54369.2021.9611866
-
期刊类型引用(1)
1. 黄力. 基于U-Net结构的噪声源定位分类方法研究. 电声技术. 2024(12): 51-53 .  百度学术
百度学术
其他类型引用(0)


计量
- 文章访问数: 725
- HTML全文浏览量: 39
- PDF下载量: 53
- 被引次数: 1