Research on interference effect of super large cooling towers with two tower combinations under complex mountains
-
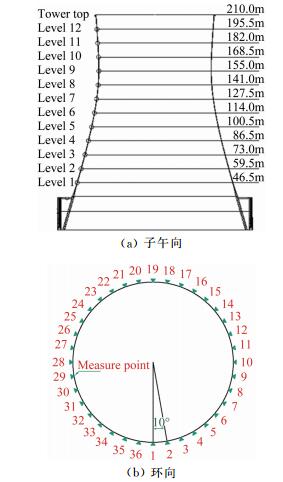
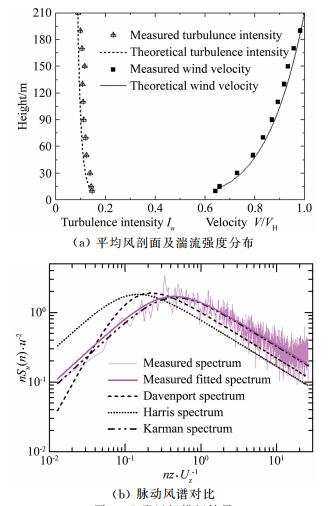
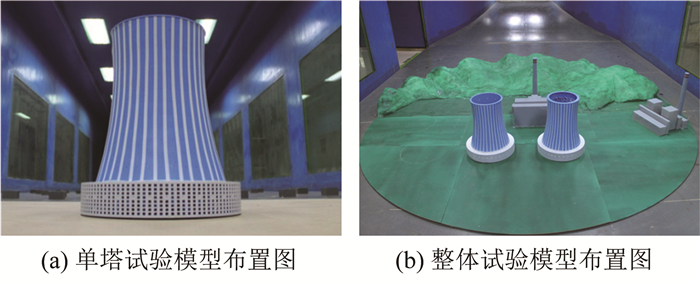
摘要: 以中国西北地区已建成的210m世界最高冷却塔为例,采用风洞试验和CFD数值模拟两种方法,获得了考虑复杂山体(海拔接近冷却塔喉部高度,且距离塔体很近)双塔布置冷却塔表面流场信息和压力分布模式。在此基础上,对比分析考虑复杂山体和建筑干扰时冷却塔表面最大负压、基于极值负风压的干扰系数和平均风压分布特性,并针对最不利工况进行复杂山体和塔群之间的风致干扰机理研究。研究表明:采用风洞试验和数值模拟两种方法得到的冷却塔基于极值负风压的干扰系数分布规律一致,两者最大值相差8%;复杂山体对冷却塔群来流湍流和表面风压分布模式的影响显著,同时受到冷却塔和干扰建筑物之间"夹道效应"的影响,最不利工况下冷却塔基于极值负风压的干扰系数可达1.586,远大于没有复杂山体时的工程常见干扰系数。Abstract: Taking a domestic super large cooling tower which is the world's tallest (210m) as an example, the flow field information and pressure distribution patterns of two cooling tower combinations were obtained considering complex mountains (close to the cooling tower, the height of which is close to the cooling tower throat elevation) based on wind tunnel experiments and CFD numerical simulation methods. On this basis, maximum negative pressures, interference factors based on the extremum of the negative wind pressure and mean wind pressures were analyzed, and then the wind-induced interference mechanism between the mountain and the towers were studied under the most unfavorable conditions. Studies show that the distribution rules of interference factors of cooling towers based on the extremum of the negative wind pressure obtained by wind tunnel experiments and CFD numerical simulation methods, respectively, are the same, and the maximum interference factors obtained by the two methods are 8% different. Complex mountains have significant influence on the flow turbulence and wind pressure distribution patterns of cooling towers. Influenced by the "channel effect" between cooling towers and buildings, the interference factor based on the extremum of the negative wind pressure under the worst condition is up to 1.586, significantly greater than the common interference factors without complex mountains.
-

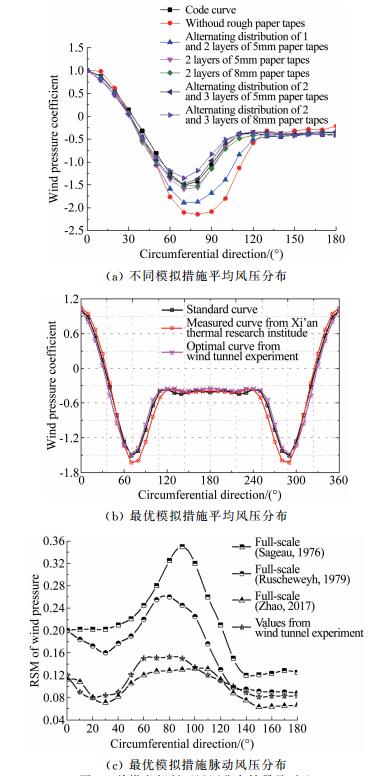
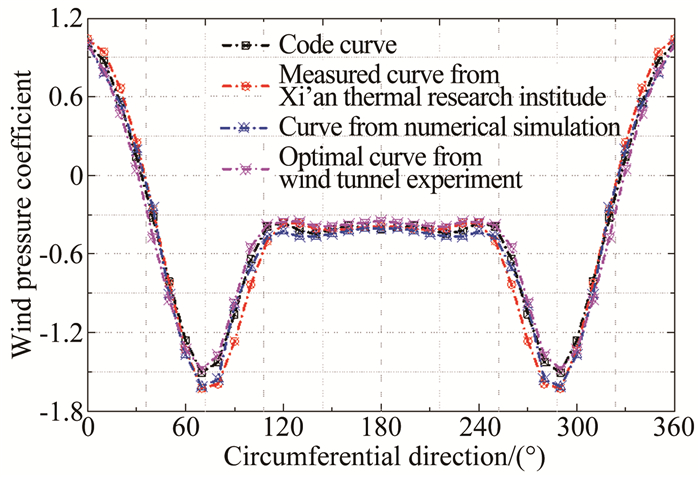
图 5 单塔喉部断面风压分布结果及对比
Figure 5. Wind pressure distribution on throat section of single tower

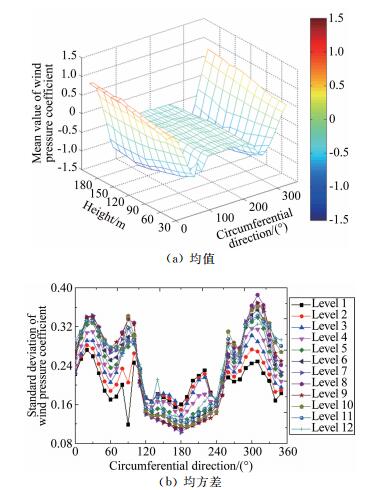
图 6 单塔风压系数均值与均方差分布
Figure 6. Mean value and standard deviation distribution of wind pressure coefficient for single tower

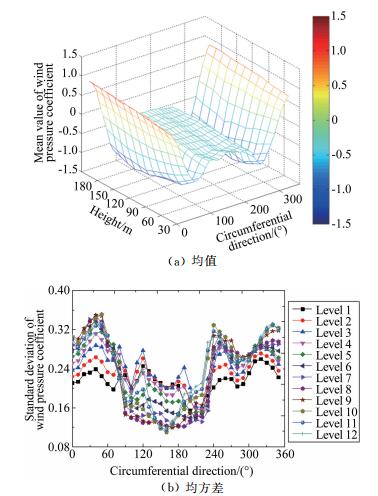
图 7 双塔布置时塔A风压系数均值与均方差三维分布
Figure 7. Mean value and standard deviation distribution of wind pressure coefficient for tower A

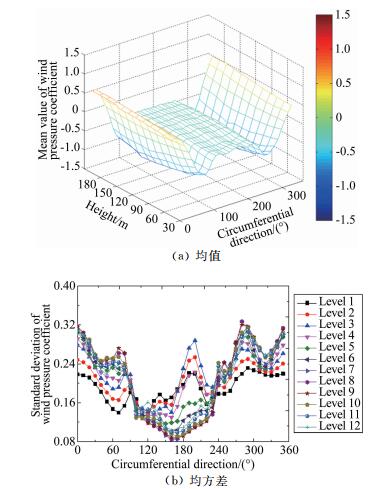
图 8 双塔布置时塔B风压系数均值与均方差三维分布
Figure 8. Mean value and standard deviation distribution of wind pressure coefficient for tower B

图 11 试验结果与规范及实测结果对比
Figure 11. Comparison among experimental results, code and actual measurement results

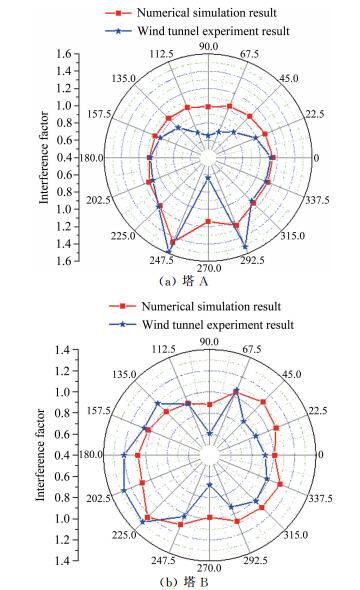
图 12 不同风向角下塔A、塔B基于极值负风压的干扰系数分布曲线
Figure 12. Interference factor distribution based on the extremum of negative wind pressure of tower A and tower B under different wind direction angles

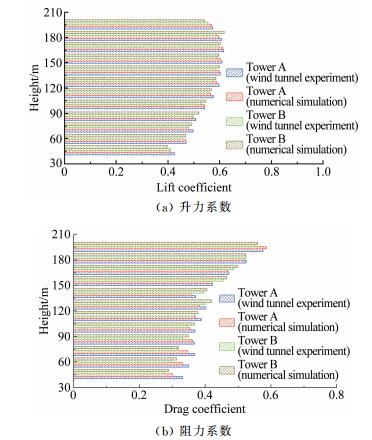
图 13 最不利风向角下塔A和塔B的升力系数、阻力系数分布
Figure 13. Lift coefficient and drag coefficient distribution of tower A and tower B at the most unfavorable wind directions

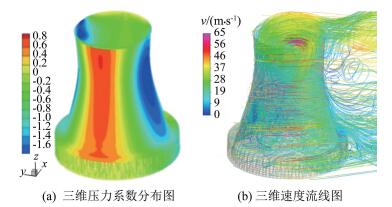
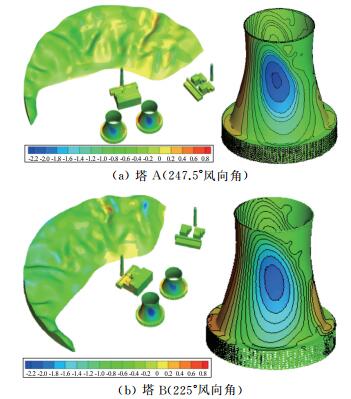
图 14 最不利风向角下塔A、塔B三维压力系数云图
Figure 14. Three-dimensional pressure coefficient contours of tower A and tower B at the most unfavorable wind directions

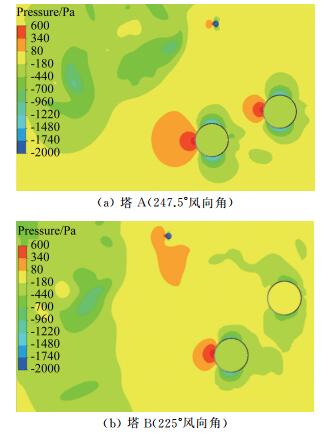
图 15 最不利风向角下塔A、塔B最大负压截面压力云图
Figure 15. Pressure contours on the biggest pressure sections of tower A and tower B at the most unfavorable wind directions

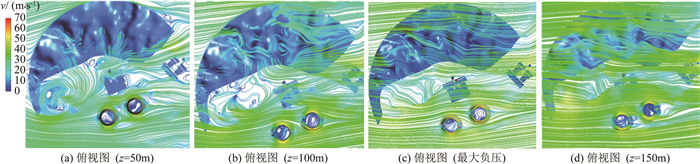
图 16 最不利工况下(247.5°风向角)塔A速度流场图
Figure 16. Velocity flow field of cooling tower A under the most disadvantage condition (247.5° wind direction condition)

图 17 最不利工况下(225°风向角)塔B速度流场图
Figure 17. Velocity flow field of cooling tower B under the most disadvantage condition (225° wind direction condition)

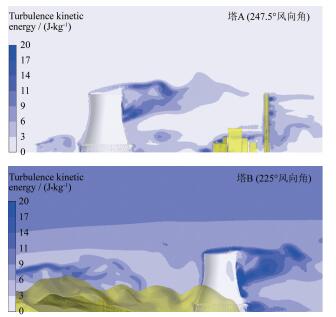
图 18 最不利风向角下塔A、塔B最大负压截面湍动能分布云图
Figure 18. Tubulence energy distribution on the biggest negative pressure sections of tower A and B at the most unfavorable wind directions

图 19 最不利风向角下塔A、塔B侧面湍动能分布云图
Figure 19. Turbulence energy distribution on the side of tower A and B at the most unfavorable wind directions
表 1 主要干扰建筑物高度汇总表(单位:m)
Table 1. Summary of main interference buildings' height (unit: m)
建筑物类别 烟囱 引风机室 送风机室 电除尘器 锅炉房 煤仓间 汽机房 建筑物1 210 33 52 36 88 55 35 建筑物2 240 66 97.5 95 36  下载: 导出CSV
表 2 单个冷却塔整体阻力系数特征值与规范及实测结果对比
Table 2. Comparison among characteristic values of drag coefficient of single tower, code values and measured results
名称 整体阻力系数特征值 均值 根方差 极值 单塔 0.408 0.120 0.708 规范 0.386 / / 西热曲线(实测结果) 0.426 / /
下载: 导出CSV
表 3 不同风向角下塔A、塔B最大负压系数
Table 3. Maximum negative pressure coefficient of tower A and tower B under different wind direction angles
角度
/(°)最大负压系数 塔A 塔B 数值模拟 风洞试验 数值模拟 风洞试验 0 1.849 1.669 1.628 1.366 22.5 1.792 1.471 1.732 1.289 45.0 1.736 1.209 1.789 1.262 67.5 1.679 1.067 1.684 1.581 90.0 1.591 0.968 1.418 0.897 112.5 1.652 1.054 1.497 1.370 135.0 1.679 1.314 1.575 1.616 157.5 1.707 1.476 1.653 1.581 180.0 1.734 1.579 1.732 1.786 202.5 1.831 1.613 1.750 1.883 225.0 1.909 1.786 1.980 1.912 247.5 2.349 2.347 1.785 1.518 270.0 1.837 0.940 1.586 1.009 292.5 2.009 2.248 1.729 1.376 315.0 1.843 1.644 1.765 1.501 337.5 1.847 1.658 1.802 1.455
下载: 导出CSV
表 4 国内电厂典型群塔组合最不利来流风向角下最大干扰系数汇总表
Table 4. Summary of maximal interference factors for combined towers under the worst condition in domestic factories
编号 冷却塔类别和高度 群塔组合 场地类别 风洞试验模型 干扰系数 干扰参数 1 湿冷塔(150m) 双塔 B类 1:200刚体测压 1.107 迎风面子午向轴力均值 2 湿冷塔(150m) 双塔 B类 1:500刚体测压 1.053 整体阻力系数均值 3 湿冷塔(150m) 双塔 B类 1:200刚体测压 1.192 最大负压均值 4 湿冷塔(177m) 双塔 A类 1:200刚体测压 1.226 整体阻力系数极值 5 湿冷塔(167m) 双塔 B类 1:200刚体测压 1.193 迎风面径向位移均值 6 湿冷塔(155m) 三塔 B类 1:200刚体测压 1.336 整体阻力系数均值 7 间冷塔(180m) 三塔 B类 1:250刚体测压 1.190 整体阻力系数均值 8 湿冷塔(150m) 四塔 B类 1:200刚体测压 1.254 整体阻力系数极值 9 湿冷塔(177m) 四塔 A类 1:200刚体测压 1.385 整体阻力系数极值 10 湿冷塔(184m) 八塔 B类 1:200刚体测压 1.444 整体阻力系数极值
下载: 导出CSV
-
[1] 中华人民共和国住房和城乡建设部.工业循环水冷却设计规范: GB/T50102-2014[S].北京: 中国计划出版社, 2015.Ministry of Housing and Urban-Rural Development of the People's Republic of China. Code for design of cooling for industrial recirculating water: GB/T50102-2014[S]. Beijing: China planning Press, 2015. [2] Niemann H J, Kopper H D. Influence of adjacent buildings on wind effects on cooling towers[J]. Engineering Structures, 1998, 20(10):874-880. doi: 10.1016/S0141-0296(97)00131-4 [3] Ke S T, Ge Y J, Zhao L, et al. Wind-induced responses of super-large cooling towers[J]. Journal of Central South University of Technology. 2013, 20(11):3216-3227. doi: 10.1007/s11771-013-1846-7 [4] 张军锋, 赵林, 柯世堂, 等.大型冷却塔双塔组合表面风压干扰效应试验[J].哈尔滨工业大学学报, 2011, 43(4):81-87. http://www.wanfangdata.com.cn/details/detail.do?_type=perio&id=SciencePaper201311200000002555Zhang J F, Zhao L, Ke S T, et al. Large cooling towers twin towers combination surface wind pressure interference effect test[J]. Journal of Harbin Institute of Technology, 2011, 43(4):81-87. http://www.wanfangdata.com.cn/details/detail.do?_type=perio&id=SciencePaper201311200000002555 [5] 沈国辉, 刘若斐, 孙炳楠.双塔情况下冷却塔风荷载的数值模拟[J].浙江大学学报:工学版, 2007, 41(6):1017-1022. http://d.old.wanfangdata.com.cn/Periodical/zjdxxb-gx200706029Shen G H, Liu R F, Sun B N. Two cases the numerical simulation of the cooling tower wind load[J]. Journal of Zhejiang University:Engineering Edition, 2007, 41(6):1017-1022. http://d.old.wanfangdata.com.cn/Periodical/zjdxxb-gx200706029 [6] 柯世堂, 王浩, 余玮.典型四塔组合特大型冷却塔群风荷载干扰效应[J].同济大学学报:自然科学版, 2017, 45(10):1421-1428. http://d.old.wanfangdata.com.cn/Periodical/tjdxxb201710002Ke S T, Wang H, Yu W. The effect of wind load of typical four-tower composite large cooling tower groups[J]. Journal of Tongji University:Natural Science Edition, 2017, 45(10):1421-1428. http://d.old.wanfangdata.com.cn/Periodical/tjdxxb201710002 [7] 王建明, 贾丛贤, 陈凯.山地附近风场结构的实验研究[J].实验流体力学, 2008, 22(4):42-47. doi: 10.3969/j.issn.1672-9897.2008.04.010Wang J M, Jia C X, Chen K. Experimental study on wind field structure near mountain area[J]. Journal of Experiments in Fluid Mechanics, 2008, 22(4):42-47. doi: 10.3969/j.issn.1672-9897.2008.04.010 [8] 周旋, 牛华伟, 陈政清, 等.双冷却塔布置与山地环境风干扰作用效应研究[J].建筑结构学报, 2014, 35(12):140-148. http://d.old.wanfangdata.com.cn/Periodical/jzjgxb201412018Zhou X, Niu H W, Chen Z Q, et al. Double cooling tower is decorated with mountain environment wind interference effect research[J]. Journal of Building Structures, 2014, 35(12):140-148. http://d.old.wanfangdata.com.cn/Periodical/jzjgxb201412018 [9] Ke S T, Liang J, Zhao L, et al. Influence of ventilation rate on the aerodynamic interference between two extra-large indirect dry cooling towers by CFD[J]. Wind and Structures, 2015, 20(3):449-468. doi: 10.12989/was.2015.20.3.449 [10] 柯世堂, 葛耀君, 赵林.基于气弹试验大型冷却塔结构风致干扰特性分析[J].湖南大学学报:自然科学版, 2010, 37(11):18-23. http://d.old.wanfangdata.com.cn/Periodical/hndxxb201011004Ke S T, Ge Y J, Zhao L. Based on the gas bomb test of large cooling tower on wind-induced interference characteristics ana-lysis[J]. Journal of Hunan University:Natural Science Edition, 2010, 37(11):18-23. http://d.old.wanfangdata.com.cn/Periodical/hndxxb201011004 [11] 中华人民共和国住房和城乡建设部.建筑工程风洞试验方法标准: JSJ/T 338-2014[S].北京: 中国建筑工业出版社, 2014.Ministry of Housing and Urban-Rural Development of the People's Republic of China. Standard for wind tunnel test of buildings and structures: JSJ/T 338-2014[S]. Beijing: China Building Industry Press, 2014. [12] 孙天风, 周良茂.无肋双曲线型冷却塔风压分布的全尺寸测量和风洞研究[J].空气动力学学报, 1983, 12(4):12-17. http://www.wanfangdata.com.cn/details/detail.do?_type=perio&id=QK000001972292Sun T F, Zhou L M. Without ribs the elliptic wind pressure distribution of the cooling tower full size measurement and wind tunnel study[J]. Acta Aerodynamica Sinica, 1983, 12(4):12-17. http://www.wanfangdata.com.cn/details/detail.do?_type=perio&id=QK000001972292 [13] Ruscheweyh H. Wind loadings on the television tower, Hamburg, Germany[J]. Journal of Industrial Aerodynamics, 1975, 1:315-333. doi: 10.1016/0167-6105(75)90026-4 [14] Sageau J F, Hamonou M. Application of data acquisition system for on site measurements of wind effects on structures[C]//Von Karman Institute for Fluid Dynamics. Data acquisition systems & data analysis in fluid dynamics. 1979. [15] Zhao L, Ge Y J, Kareem A. Fluctuating wind pressure distribution around full-scale cooling towers[J]. Journal of Wind Engineering & Industrial Aerodynamics, 2017, 165(6):34-45. [16] Genç M S. Numerical simulation of flow over a thin aerofoil at a high reynolds number using a transition model[J]. Journal of Mechanical Engineering Science, 2010, 1(C10):1-10. http://www.wanfangdata.com.cn/details/detail.do?_type=perio&id=8786bb91c1b10e8095222a4273fbee55 [17] GB-R610Ue. VGB-Guideline: structural design of cooling tower-technical guideline for the structural design, computation and execution of cooling towers[S]. Essen: BTR Bautechnik Bei Kuhlturmen, 2005. [18] 余文林, 柯世堂, 杜凌云.复杂山地环境下四塔组合特大型冷却塔风致干扰效应研究[J].振动与冲击, 2017, 36(24):116-123. http://d.old.wanfangdata.com.cn/Periodical/zdycj201724018Yu W L, Ke S T, Du L Y. Study on the wind induced distur-bance of four tower combined in complex mountain environments[J]. Journal of Vibration and Shock, 2017, 36(24):116-123. http://d.old.wanfangdata.com.cn/Periodical/zdycj201724018 [19] 张军锋, 葛耀君, 赵林.群塔布置对冷却塔整体风荷载和风致响应的不同干扰效应[J].工程力学, 2016, 33(8):15-23, 44. http://www.cnki.com.cn/Article/CJFDTOTAL-GCLX201608005.htmZhang J F, Ge Y J, Zhao L. Different interference effects of group tower layout on overall wind load and wind response of cooling tower[J]. Engineering Mechanics, 2016, 33(8):15-23, 44. http://www.cnki.com.cn/Article/CJFDTOTAL-GCLX201608005.htm [20] 沈国辉, 鲍侃袁, 孙炳楠, 等.单塔和双塔情况下大型冷却塔的表面风压研究[J].华中科技大学学报:自然科学版, 2011, 39(7):104-108. http://www.cnki.com.cn/Article/CJFDTOTAL-HZLG201107026.htmShen G H, Bao K Y, Sun B N, et al. Study on the surface wind pressure of large cooling towers in single tower and twin towers[J]. Journal of Huazhong University of Science and Technology:Natural Science Edition, 2011, 39(7):104-108. http://www.cnki.com.cn/Article/CJFDTOTAL-HZLG201107026.htm -


 点击查看大图

计量
- 文章访问数: 167
- HTML全文浏览量: 85
- PDF下载量: 4
- 被引次数: 0