Wind field measurement over complex landforms based on Multi-rotor Unmanned Aircraft
-
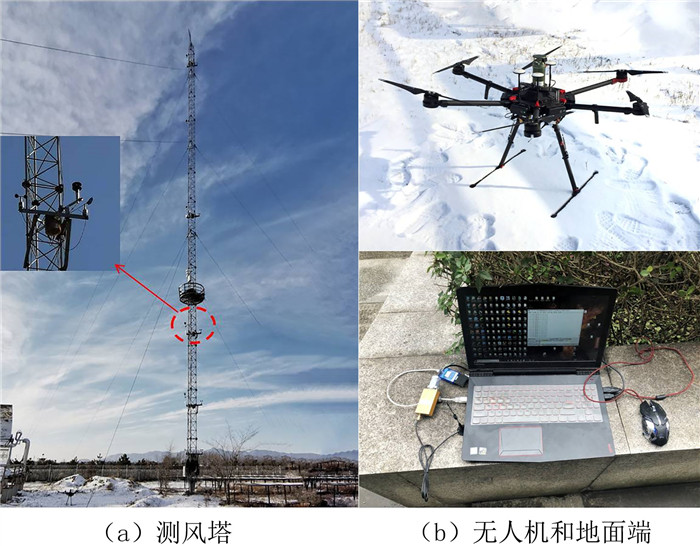
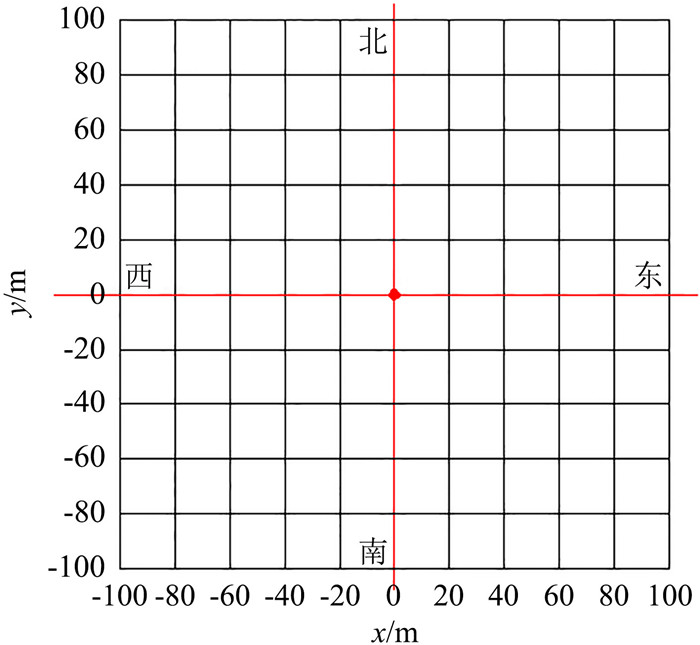
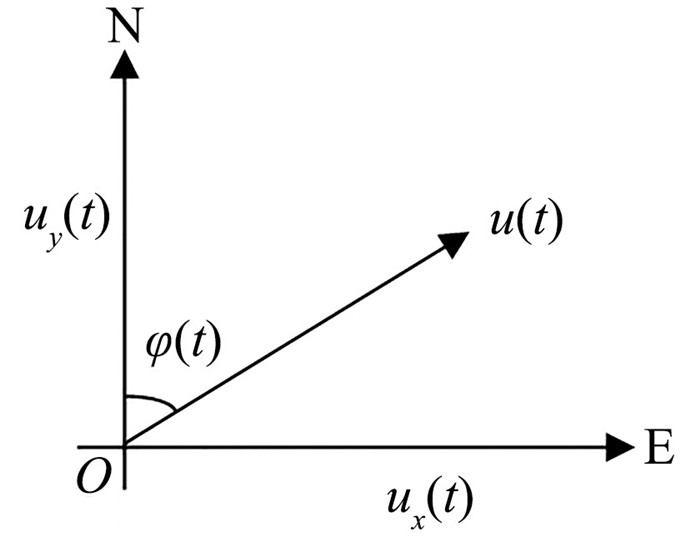
摘要: 本文研究了利用多旋翼无人机搭载风速风向测量设备对不同地貌上空平面风场实测分析的方法。以北京市延庆区某试验基地内的测风塔为参考,首先对无人机测风准确性进行研究,其次取相同时间段内测风塔与不同测点位置无人机的实测风速风向数据进行正交分解处理,分析得到无人机和测风塔风速、湍流度的相互比值关系,通过测风塔数据和比值关系,可以推知空中不同测点的风速和风向数据,进而获得复杂地貌影响下的上空风场状况。实测结果表明:修正后无人机平均风速、平均风向与测风塔相比误差较小,无人机测量得到湍流度较测风塔更大,通过滑动平均法可以一定程度上减小无人机测得的湍流度;空中平面风场状况受地貌影响较大,复杂地貌上空风场波动更大。通过现场实测,初步验证了应用多旋翼无人机搭载风速仪在不同地貌上空实现空中平面风场测量的可行性,可为局部区域风场测量、风电场微观选址等提供新思路和新方法。Abstract: The purpose of this study is to explore the method of measuring planar wind field over different landforms based on Multi-rotor Unmanned Aircraft (MUA) equipped with a wind speed and direction measurement device. In this study, a wind tower of a test base in Yanqing, Beijing is used as a reference. Firstly, the accuracy of MUA wind measurement is studied. Then, the wind speed and direction measured by MUA at different measuring points and the wind tower in the same period are taken for orthogonal decomposition to obtain the ratio of wind speed and turbulence between MUA and the wind tower. Through the data of the wind tower and the ratio, the wind speed and direction of different positions are deduced, and the wind field over the complex landform is obtained. The results show that the error of MUA average wind speed and average wind direction after correction is smaller. The turbulence measured by MUA is larger than that measured by the wind tower, and the turbulence measured by MUA can be reduced partly by the moving average method. The wind field conditions are greatly affected by the landforms, and the wind field over complex landforms fluctuate more frequently. The study verifies the feasibility of using MUA equipped with an anemometer to measure the planar wind field over different landforms, which can provide reference ideas and methods for wind field measurement in a local area and micrositing of wind farms.
-

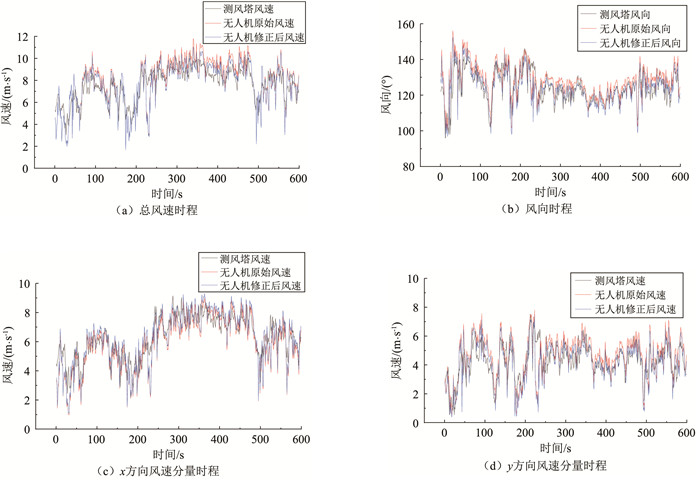
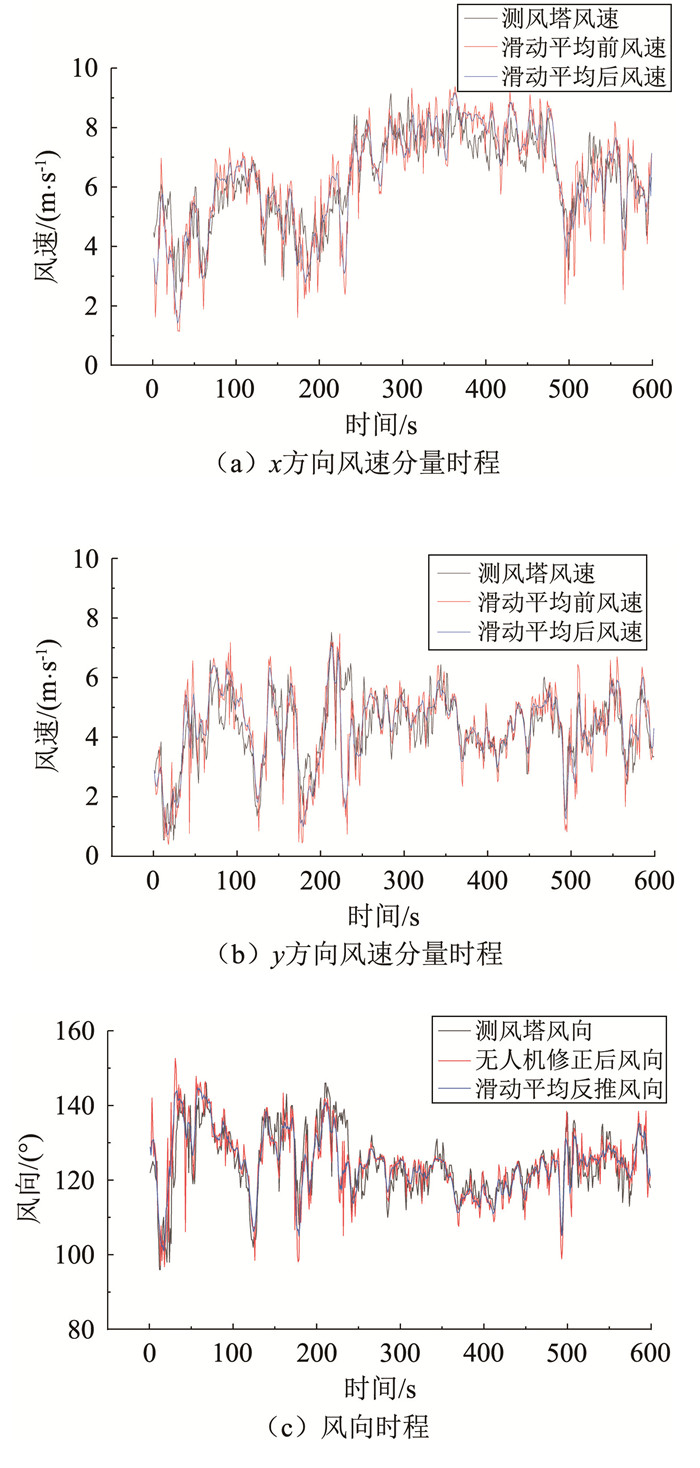
图 5 测风塔、修正后无人机风速风向时程图
Figure 5. Wind speed and direction time history of wind tower and modified UAV

图 6 测风塔、滑动平均后无人机风速风向时程图
Figure 6. Wind speed and wind direction time history of wind tower and UAV after moving average
表 1 超声波风速仪参数
Table 1. Parameters of ultrasonic anemometer
型号 风速测量 风向测量 量程 精度 量程 精度 SA210 0~50 m/s 0.5 m/s
(v≤10 m/s),
5%
(v >10 m/s)0~359° ±4°
(v≥3 m/s)WindSonic 0~60 m/s ±2% 0~359° ±3°
(v =12 m/s) 下载: 导出CSV
表 2 风速标定结果
Table 2. Wind speed calibration results
控制风速/(m·s-1) 4 6 8 10 眼镜蛇探头风速/(m·s-1) 3.57 5.43 7.22 9.12 SA210风速/(m·s-1) 3.58 5.41 7.25 9.11 误差/% 0.28 -0.37 0.42 -0.11 眼镜蛇探头风速/(m·s-1) 3.63 5.44 7.32 9.25 WindSonic风速/(m·s-1) 3.65 5.42 7.34 9.28 误差/% 0.42 -0.38 0.16 0.27
下载: 导出CSV
表 3 风速修正系数
Table 3. Correction coefficient of wind speed
风速区间/(m·s-1) [0, 6.5) [6.5, 7.5) [7.5, 8.5) [8.5, 9.5) [9.5, 10.5) [10.5, 11.5) [11.5, 12.5) 修正系数α 1.000 1.005 1.020 1.035 1.050 1.065 1.080
下载: 导出CSV
表 4 无人机风速修正前后数据对比
Table 4. Data comparison before and after MUA wind speed correction
测风塔数据 无人机风速原始数据 无人机风速修正后数据 数值 绝对误差 相对误差 数值 绝对误差 相对误差 平均风速U 7.57 m/s 7.86 m/s 0.29 m/s 3.81% 7.61 m/s 0.04m/s 0.53% 平均风向 124.35° 127.84° 3.49° 2.81% 127.91° 3.56° 2.86% ux 6.25 m/s 6.21 m/s -0.04 m/s -0.70% 6.00 m/s -0.25m/s -4.00% uy -4.27 m/s -4.82 m/s -0.55 m/s 12.84% -4.67 m/s -0.40 m/s 9.37% σx 1.45 m/s 1.90 m/s 0.45 m/s 31.03% 1.75 m/s 0.30 m/s 20.69% Ix 19.09% 24.14% 5.05% 26.45% 22.98% 3.89% 20.38% σy 1.16 m/s 1.48 m/s 0.32 m/s 27.59% 1.43 m/s 0.27 m/s 23.28% Iy 15.32% 18.90% 3.58% 23.37% 18.77% 3.45% 22.52% 注:表中相对误差=100%×(无人机数据-测风塔数据)/测风塔数据;绝对误差=无人机数据-测风塔数据。
下载: 导出CSV
表 5 无人机风向修正前后数据对比
Table 5. Data comparison before and after MUA wind direction correction
测风塔数据 无人机风向修正前数据 无人机风向修正后数据 数值 绝对误差 相对误差 数值 绝对误差 相对误差 平均风速U 7.57 m/s 7.61 m/s 0.04 m/s 0.53% 7.61 m/s 0.04m/s 0.53% 平均风向 124.35° 127.91° 3.56° 2.86% 24.42° 0.07° 0.06% ux 6.25 m/s 6.00 m/s -0.25 m/s -4.00% 6.28 m/s 0.03 m/s 0.48% uy -4.27 m/s -4.67 m/s -0.40 m/s 9.37% -4.30 m/s -0.03 m/s 0.70% σx 1.45 m/s 1.75 m/s 0.30 m/s 20.69% 1.79 m/s 0.34 m/s 23.45% Ix 19.09% 22.98% 3.89% 20.38% 23.54% 4.45% 23.31% σy 1.16 m/s 1.43 m/s 0.27 m/s 23.28% 1.37 m/s 0.21 m/s 18.10% Iy 15.32% 18.77% 3.45% 22.52% 18.06% 2.74% 15.17% 注:表中相对误差=100%×(无人机数据-测风塔数据)/测风塔数据;绝对误差=无人机数据-测风塔数据。
下载: 导出CSV
表 6 无人机数据滑动平均修正前后结果对比
Table 6. Comparison of results before and after MUA data moving average correction
测风塔数据 滑动平均修正前数据 滑动平均修正后数据 数值 绝对误差 相对误差 数值 绝对误差 相对误差 平均风速U 7.57 m/s 7.61 m/s 0.04m/s 0.53% 7.61 m/s 0.04m/s 0.53% 平均风向 124.35° 124.42° 0.07° 0.06% 124.42° 0.07° 0.06% ux 6.25 m/s 6.28 m/s 0.03m/s 0.48% 6.28 m/s 0.03m/s 0.48% uy -4.27 m/s -4.30 m/s -0.03 m/s 0.70% -4.30 m/s -0.03 m/s 0.70% σx 1.45 m/s 1.79 m/s 0.34 m/s 23.45% 1.67 m/s 0.22 m/s 15.17% Ix 19.09% 23.54% 4.45% 23.31% 21.99% 2.90% 15.19% σy 1.16 m/s 1.37 m/s 0.21 m/s 18.10% 1.21 m/s 0.05 m/s 4.31% Iy 15.32% 18.06% 2.74% 15.17% 15.93% 0.61% 3.98% 注:表中相对误差=100%×(无人机数据-测风塔数据)/测风塔数据;绝对误差=无人机数据-测风塔数据
下载: 导出CSV
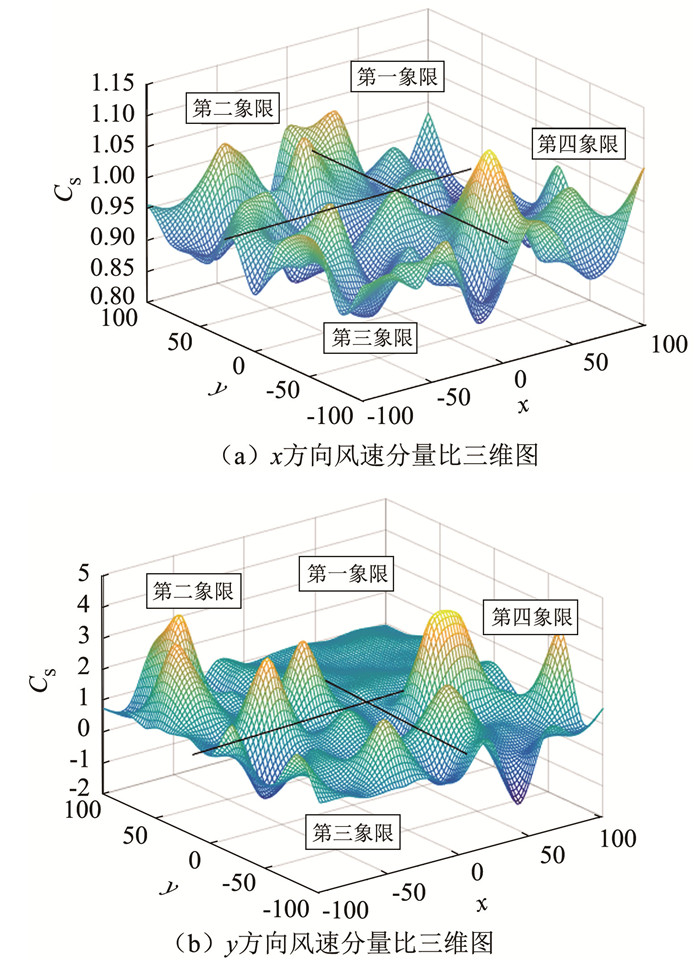
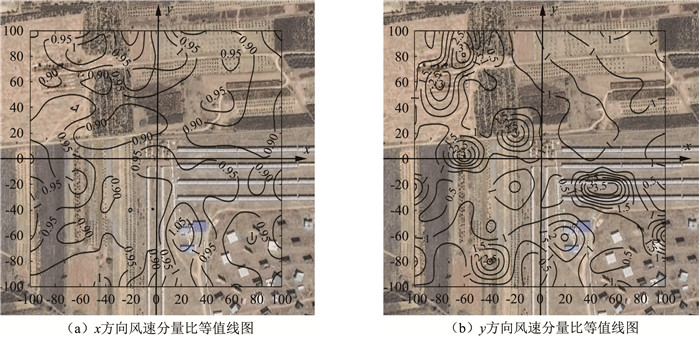
表 7 x方向风速分量比CSx
Table 7. The ratio of wind speed component in x direction CSx

-100 -80 -60 -40 -20 0 20 40 60 80 100 100 0.956 0.926 0.903 0.991 0.908 1.021 0.895 0.900 0.899 0.889 0.981 80 0.914 0.970 1.045 0.993 0.925 1.002 1.048 0.919 0.967 0.893 0.904 60 0.910 0.889 0.900 0.868 1.044 0.980 0.948 0.917 0.942 0.885 0.889 40 0.912 0.991 1.000 0.931 0.881 0.910 0.930 0.956 0.955 0.864 0.927 20 0.966 0.968 0.876 0.877 0.919 0.895 0.906 0.868 0.886 0.879 0.915 0 0.892 0.966 0.956 0.920 0.949 1.000 0.939 0.947 0.934 0.903 0.918 -20 0.982 0.943 0.987 0.889 0.924 0.930 0.959 0.961 0.979 0.873 0.993 -40 1.020 0.952 0.938 0.896 0.952 0.902 1.027 0.941 0.943 0.940 0.917 -60 1.014 0.904 0.885 0.954 0.909 0.931 1.098 0.976 0.962 0.999 0.853 -80 0.925 0.943 0.918 0.955 0.970 0.884 1.025 0.928 0.954 0.971 0.960 -100 0.986 0.993 0.959 1.021 0.880 0.928 1.014 0.975 0.900 0.926 1.054
下载: 导出CSV
表 8 y方向风速分量比CSy
Table 8. The ratio of wind speed component in y direction CSy

-100 -80 -60 -40 -20 0 20 40 60 80 100 100 0.734 0.671 2.498 0.563 1.266 0.924 0.993 1.045 0.925 1.022 0.930 80 0.927 0.872 3.540 0.180 1.119 1.073 0.887 0.970 1.108 1.130 0.938 60 0.730 3.181 0.987 1.166 0.708 1.093 1.074 0.913 0.965 0.988 1.164 40 0.909 2.162 1.152 0.758 0.940 0.931 0.965 1.086 0.941 1.042 0.904 20 1.051 0.676 1.251 0.897 3.313 0.959 1.138 1.047 1.021 0.858 0.997 0 0.842 1.148 3.467 0.964 0.871 1.000 0.767 1.104 0.756 0.931 1.309 -20 2.113 0.417 0.659 0.930 1.602 0.804 0.404 3.738 3.629 0.556 0.662 -40 0.731 0.357 1.148 0.672 0.993 0.543 0.798 0.672 1.247 1.290 0.376 -60 0.933 1.057 1.192 0.625 1.084 1.412 2.584 1.177 0.766 0.821 3.418 -80 2.141 0.734 1.157 3.119 0.983 0.116 1.498 0.522 0.330 0.695 0.761 -100 0.894 0.887 0.669 0.702 0.693 0.506 1.438 0.865 1.278 0.880 1.473
下载: 导出CSV
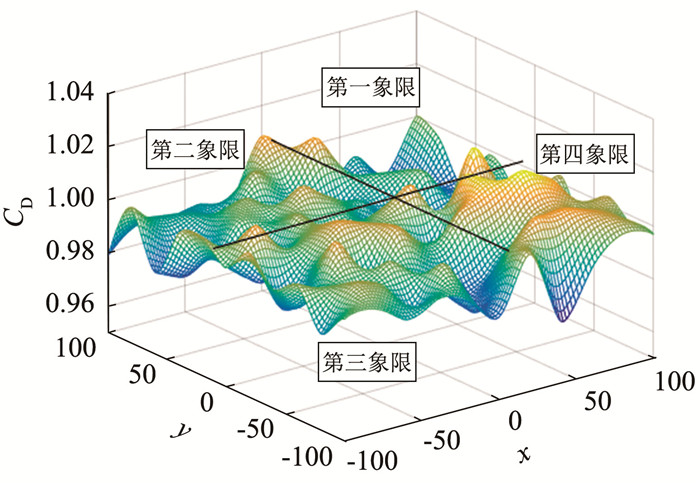
表 9 风向比CD
Table 9. The ratio of wind direction CD

-100 -80 -60 -40 -20 0 20 40 60 80 100 100 0.979 0.988 0.987 0.989 0.987 1.008 0.988 0.979 0.991 0.981 1.000 80 1.001 0.991 0.992 0.988 1.002 0.995 1.009 0.988 0.984 0.977 0.995 60 0.981 0.977 0.994 1.000 0.987 0.988 0.987 0.995 0.993 0.986 0.981 40 1.000 0.987 0.997 0.995 1.005 0.997 0.993 0.984 0.997 0.981 0.998 20 1.002 0.988 0.979 1.001 0.991 0.994 0.978 0.982 0.983 0.998 0.990 0 0.995 1.008 0.996 1.002 0.996 1.000 1.007 0.986 1.015 0.993 0.972 -20 1.005 0.982 0.995 1.005 1.003 0.996 0.984 1.012 0.985 0.996 1.002 -40 0.995 0.986 1.007 0.986 1.004 0.994 1.005 1.011 1.015 1.008 0.986 -60 1.001 0.997 0.994 1.000 0.990 0.982 0.985 0.995 1.004 1.002 1.003 -80 0.987 1.001 0.999 0.987 1.000 0.979 0.998 1.008 1.008 1.004 0.997 -100 0.996 0.997 0.990 0.994 0.991 0.981 1.002 0.973 0.990 1.000 0.997
下载: 导出CSV
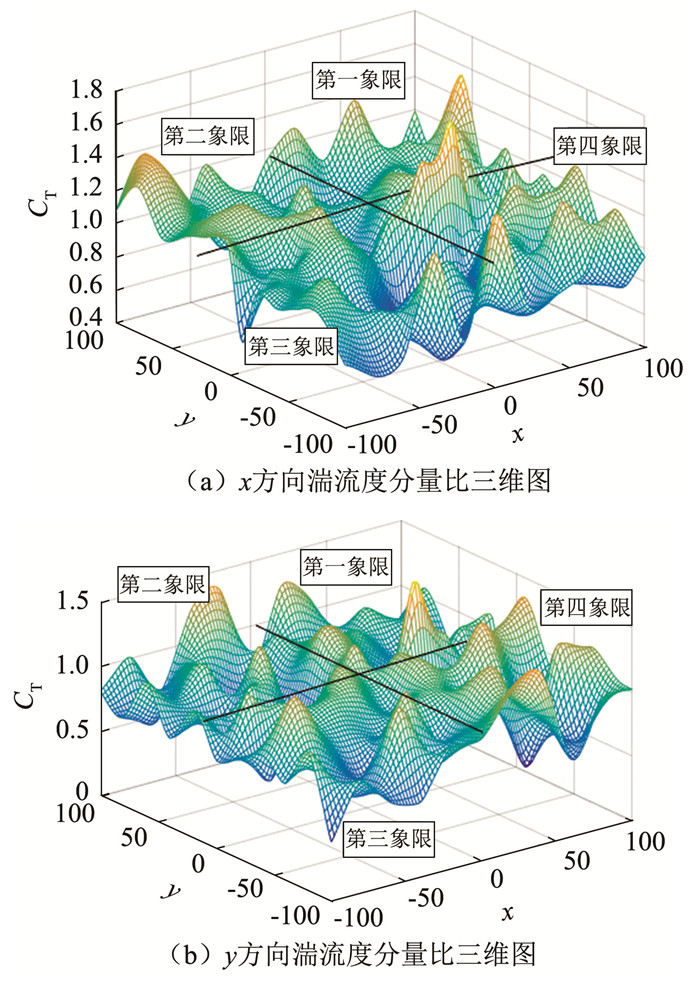
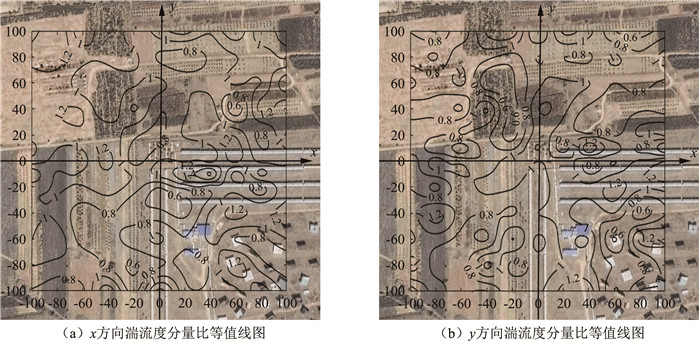
表 10 x方向湍流度分量比CTx
Table 10. The ratio of turbulence component in x direction CTx

-100 -80 -60 -40 -20 0 20 40 60 80 100 100 1.074 1.365 0.853 1.209 0.844 1.119 1.281 1.039 1.355 0.878 1.187 80 1.281 1.314 1.057 1.047 1.050 0.769 0.678 0.830 0.989 1.123 0.975 60 1.041 1.106 0.879 0.908 0.970 1.045 0.946 0.925 1.039 0.998 1.537 40 1.111 1.192 1.186 0.811 1.226 0.827 0.948 1.123 0.553 1.297 1.010 20 1.172 1.099 1.155 1.144 0.851 0.753 1.027 1.171 1.172 0.747 1.215 0 1.123 0.935 0.917 1.269 0.722 1.000 0.942 0.916 1.250 0.947 0.917 -20 0.633 1.019 1.028 1.164 0.976 1.096 1.431 1.644 0.714 1.260 1.155 -40 0.932 0.960 0.671 0.816 0.642 0.663 0.540 1.017 1.285 1.194 1.306 -60 0.993 1.126 0.699 0.731 0.920 1.038 0.806 1.034 0.789 0.755 0.994 -80 1.005 0.931 0.953 0.764 0.565 0.772 0.755 0.821 1.319 0.874 0.697 -100 0.784 0.665 0.753 1.316 0.737 1.449 0.881 0.855 0.949 1.286 0.945
下载: 导出CSV
表 11 y方向湍流度分量比CTy
Table 11. The ratio of turbulence component in y direction CTy

-100 -80 -60 -40 -20 0 20 40 60 80 100 100 0.814 1.013 0.682 1.242 1.337 0.617 1.245 1.074 0.613 0.498 0.691 80 0.693 0.579 0.955 0.865 0.716 1.011 0.804 0.769 1.035 0.855 1.062 60 1.050 0.866 1.043 0.439 0.568 0.944 1.035 1.010 0.800 0.898 0.749 40 0.695 0.740 0.580 1.217 0.517 1.185 1.066 0.746 0.691 0.770 0.689 20 0.900 0.609 0.454 0.860 0.751 1.225 0.671 1.615 1.130 0.733 0.408 0 0.694 1.134 0.942 0.831 1.151 1.000 1.112 0.774 0.791 1.035 1.198 -20 0.791 0.541 0.911 1.044 1.026 0.832 1.165 1.047 1.328 1.064 1.091 -40 0.891 1.278 0.912 0.818 0.774 0.999 1.029 0.805 0.998 0.469 0.789 -60 0.754 0.905 0.713 0.583 1.211 0.757 1.076 1.195 0.374 1.240 1.175 -80 1.084 0.704 0.676 1.240 0.731 0.873 1.012 1.022 0.780 0.636 1.091 -100 0.467 0.872 0.644 0.594 0.954 0.953 1.270 1.322 0.597 1.007 1.019
下载: 导出CSV
-
[1] 黄本才. 结构抗风分析原理及应用[M]. 上海: 同济大学出版社, 2001: 47-49.HUANG B C. Principle and application of wind resistance analysis[M]. Shanghai: Tongji University Press, 2001: 47-49. [2] 陈爱, 刘宏昭, 杨迎超, 等. 复杂地形条件下风力机微观选址[J]. 太阳能学报, 2012, 33(5): 782-788. doi: 10.3969/j.issn.0254-0096.2012.05.013CHEN A, LIU H Z, YANG Y C, et al. Micro-siting technique forwind turbines under complex terrain[J]. Acta Energiae Solaris Sinica, 2012, 33(5): 782-788. doi: 10.3969/j.issn.0254-0096.2012.05.013 [3] REN H H, LAIMA S J, CHEN W L, et al. Numerical simulation and prediction of spatial wind field under complex terrain[J]. Journal of Wind Engineering and Industrial Aerodynamics, 2018, 180: 49-65. doi: 10.1016/j.jweia.2018.07.012 [4] PALMA J M L M, CASTRO F A, RIBEIRO L F, et al. Linear and nonlinear models in wind resource assessment and wind turbine micro-siting in complex terrain[J]. Journal of Wind Engineering and Industrial Aerodynamics, 2008, 96(12): 2308-2326. doi: 10.1016/j.jweia.2008.03.012 [5] 雷若冰, 徐箭, 孙辉, 等. 基于相关性分析的风电场群风速分布预测方法[J]. 电力自动化设备, 2016, 36(5): 134-140. doi: 10.16081/j.issn.1006-6047.2016.05.023LEI R B, XU J, SUN H, et al. Wind speed distribution forecasting based on correlation analysis for wind farm group[J]. Electric Power Automation Equipment, 2016, 36(5): 134-140. doi: 10.16081/j.issn.1006-6047.2016.05.023 [6] 胡尚瑜, 李秋胜. 低矮房屋风荷载实测研究(I)——登陆台风近地边界层风特性[J]. 土木工程学报, 2012, 45(2): 77-84. doi: 10.15951/j.tmgcxb.2012.02.020HU S Y, LI Q S. Field measurements of wind loads on a low-rise building: Part I: Near-surface boundary layer wind characteristics of landfalltyphoons[J]. China Civil Engineering Journal, 2012, 45(2): 77-84. doi: 10.15951/j.tmgcxb.2012.02.020 [7] JING H M, LIAO H L, MA C M, et al. Field measurement study of wind characteristics at different measuring positions in a mountainous valley[J]. Experimental Thermal and Fluid Science, 2020, 112: 109991. doi: 10.1016/j.expthermflusci.2019.109991 [8] 李正农, 余蜜, 吴红华, 等. 某低矮模型房屋实测风场和风压的相关性研究[J]. 湖南大学学报(自然科学版), 2016, 43(5): 70-78. doi: 10.3969/j.issn.1674-2974.2016.05.009LI Z N, YU M, WU H H, et al. Correlation research of the measured wind field and wind pressure of a low-rise building[J]. Journal of Hunan University (Natural Sciences), 2016, 43(5): 70-78. doi: 10.3969/j.issn.1674-2974.2016.05.009 [9] HUANG B, LI Z N, ZHAO Z F, et al. Near-ground impurity-free wind and wind-driven sand of photovoltaic power stations in a desert area[J]. Journal of Wind Engineering and Industrial Aerodynamics, 2018, 179: 483-502. doi: 10.1016/j.jweia.2018.06.017 [10] 李正农, 吴卫祥, 王志峰. 北京郊外近地面风场特性实测研究[J]. 建筑结构学报, 2013, 34(9): 82-90. doi: 10.14006/j.jzjgxb.2013.09.010LI Z N, WU W X, WANG Z F. Field measurements of wind characteristics near ground in Beijing suburbs[J]. Journal of Building Structures, 2013, 34(9): 82-90. doi: 10.14006/j.jzjgxb.2013.09.010 [11] HOLLAND G J, WEBSTER P J, CURRY J A, et al. The aerosonde robotic aircraft: A new paradigm for environmental observations[J]. Bulletin of the American Meteorological Society, 2001, 82(5): 889-902. doi: 10.1175/1520-0477(2001)0822.3.CO;2 [12] 马舒庆, 汪改, 潘毅. 微型无人驾驶飞机探空初步试验研究[J]. 南京气象学院学报, 1997, 20(2): 171-177. https://www.cnki.com.cn/Article/CJFDTOTAL-NJQX702.004.htmMA S Q, WANG G, PAN Y. Experiments on robot craft sounding[J]. Journal of Nanjing Institute of Meteorology, 1997, 20(2): 171-177. https://www.cnki.com.cn/Article/CJFDTOTAL-NJQX702.004.htm [13] 周伟静, 沈怀荣. 一种基于小型无人机的风场测量方法[J]. 测试技术学报, 2009, 23(4): 297-302. doi: 10.3969/j.issn.1671-7449.2009.04.004ZHOU W J, SHEN H R. A wind measuring method based on a mini-UAV[J]. Journal of Test and Measurement Technology, 2009, 23(4): 297-302. doi: 10.3969/j.issn.1671-7449.2009.04.004 [14] BRUSCHI P, PIOTTO M, DELL'AGNELLO F, et al. Wind speed and direction detection by means of solid-state anemometers embedded on small quadcopters[J]. Procedia Engineering, 2016, 168: 802-805. doi: 10.1016/j.proeng.2016.11.274 [15] 李正农, 胡昊辉, 沈义俊. 六旋翼无人机旋翼转动对测风准确性的影响研究[J]. 实验流体力学, 2019, 33(6): 7-14. doi: 10.11729/syltlx20190047LI Z N, HU H H, SHEN Y J. The influence of rotor rotation of hexacopter on wind measurement accuracy[J]. Journal of Experiments in Fluid Mechanics, 2019, 33(6): 7-14. doi: 10.11729/syltlx20190047 [16] 裴益轩, 郭民. 滑动平均法的基本原理及应用[J]. 火炮发射与控制学报, 2001, 22(1): 21-23. doi: 10.3969/j.issn.1673-6524.2001.01.007PEI Y X, GUO M. The fundamental principle and application of sliding average method[J]. Gun Launch & Control Journal, 2001, 22(1): 21-23. doi: 10.3969/j.issn.1673-6524.2001.01.007 -


 点击查看大图
计量
- 文章访问数: 226
- HTML全文浏览量: 83
- PDF下载量: 23
- 被引次数: 0